Accolade Results Presentation Deck
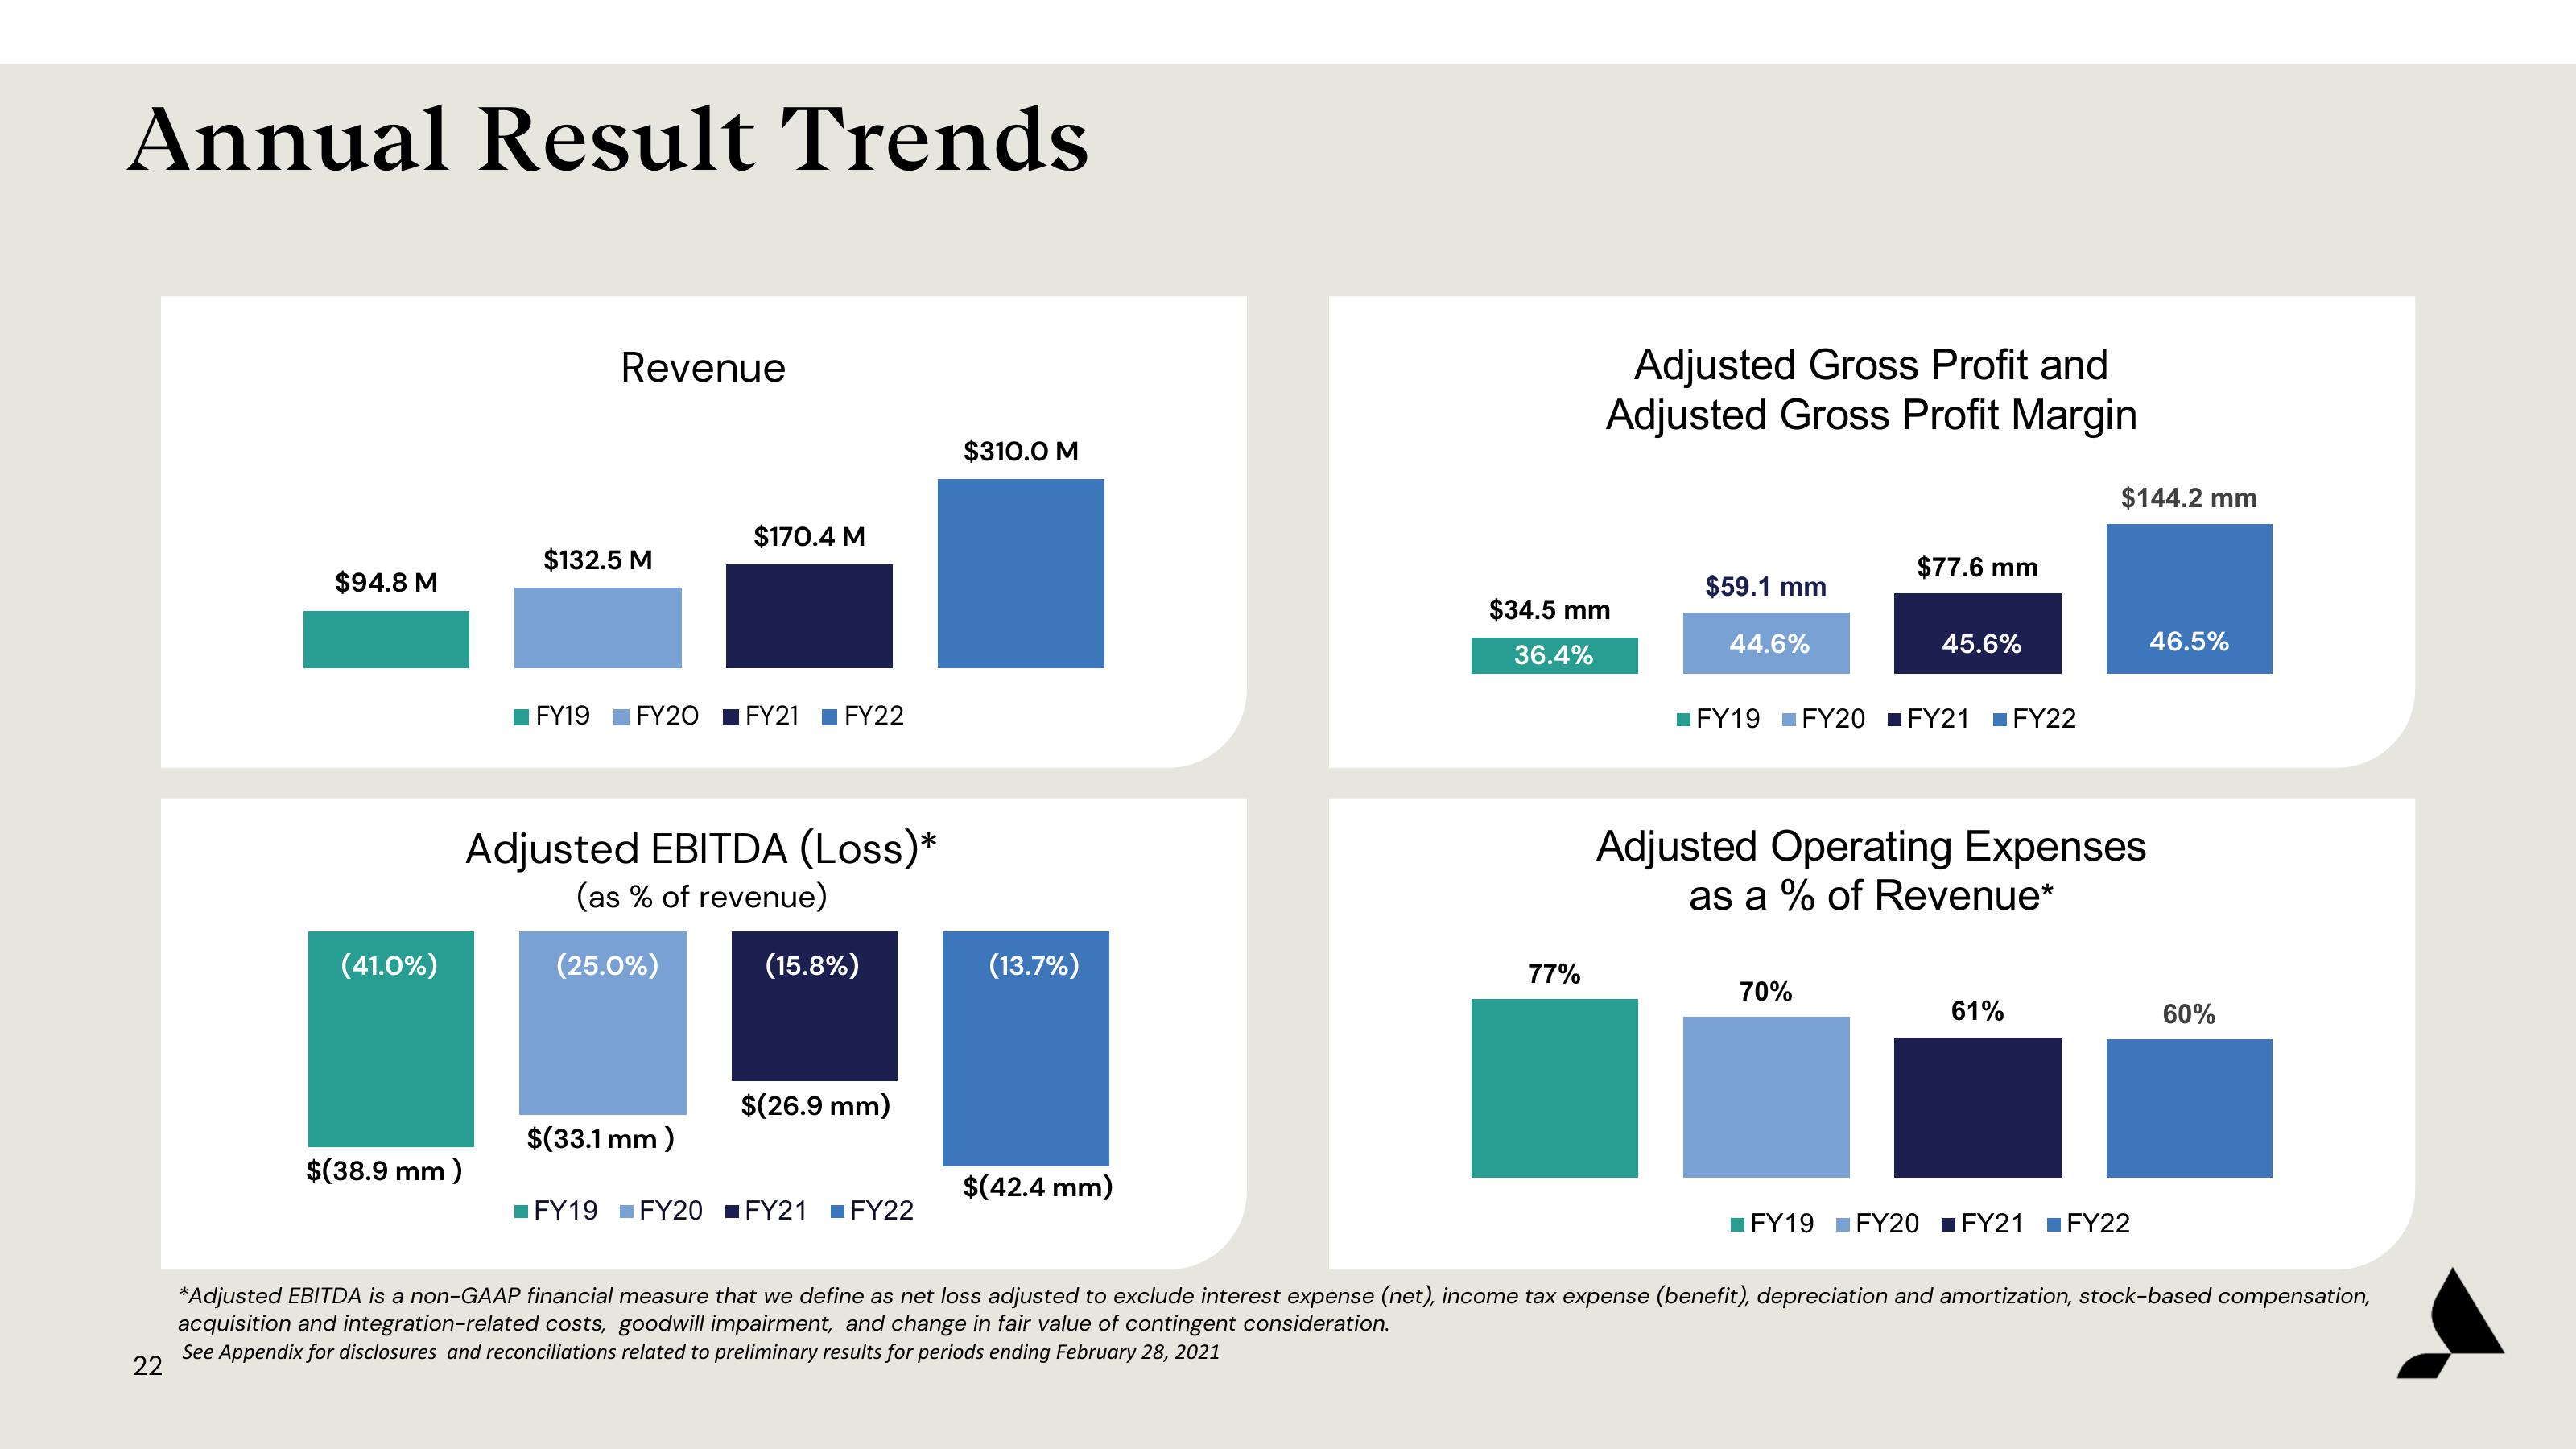
Annual Result Trends
$94.8 M
(41.0%)
$(38.9 mm)
Revenue
$132.5 M
$170.4 M
FY19 FY20 FY21 FY22
Adjusted EBITDA (Loss)*
(as % of revenue)
(25.0%)
$(33.1 mm)
(15.8%)
$(26.9 mm)
■FY19 FY20 ■ FY21 ■FY22
$310.0 M
(13.7%)
$(42.4 mm)
Adjusted Gross Profit and
Adjusted Gross Profit Margin
$34.5 mm
36.4%
77%
$59.1 mm
44.6%
$77.6 mm
45.6%
■FY19 FY20 ■ FY21
70%
■FY22
Adjusted Operating Expenses
as a % of Revenue*
$144.2 mm
61%
FY19 FY20 FY21 FY22
46.5%
60%
*Adjusted EBITDA is a non-GAAP financial measure that we define as net loss adjusted to exclude interest expense (net), income tax expense (benefit), depreciation and amortization, stock-based compensation,
acquisition and integration-related costs, goodwill impairment, and change in fair value of contingent consideration.
See Appendix for disclosures and reconciliations related to preliminary results for periods ending February 28, 2021
22View entire presentation