Playboy SPAC Presentation Deck
PLAYBOY 2020
36
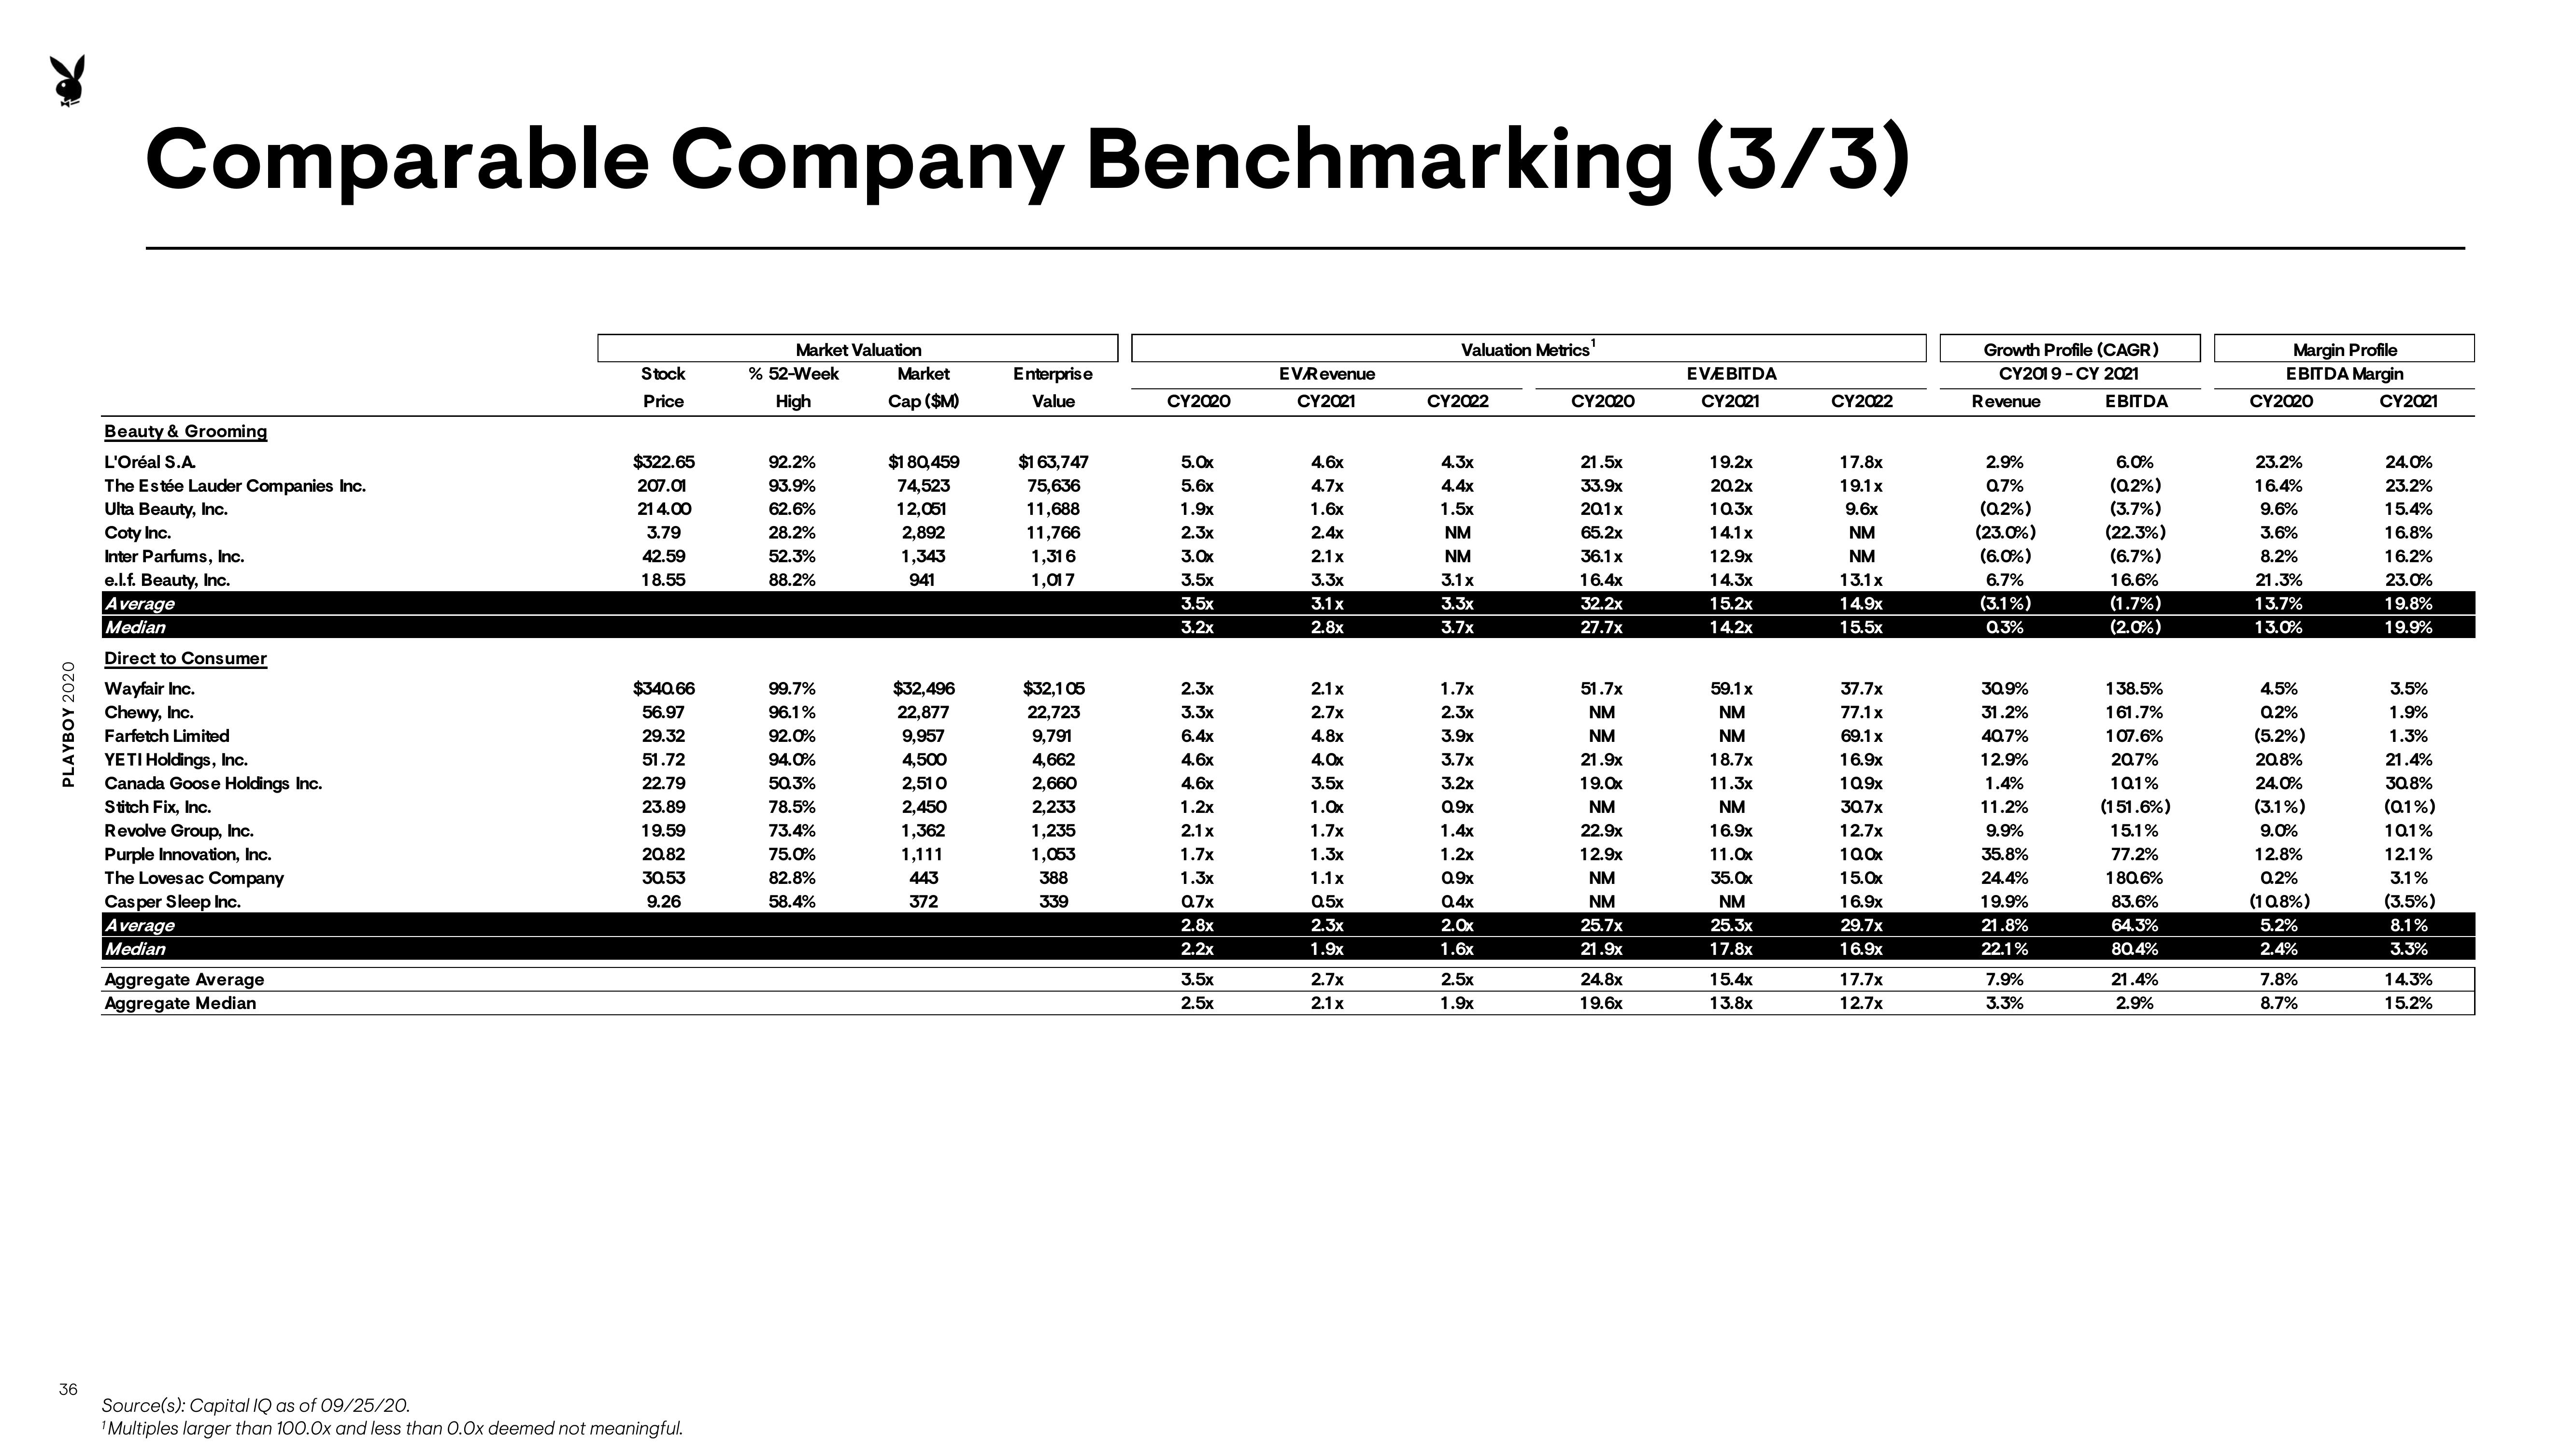
Comparable Company Benchmarking (3/3)
Beauty & Grooming
L'Oréal S.A.
The Estée Lauder Companies Inc.
Ulta Beauty, Inc.
Coty Inc.
Inter Parfums, Inc.
e.l.f. Beauty, Inc.
Average
Median
Direct to Consumer
Wayfair Inc.
Chewy, Inc.
Farfetch Limited
YETI Holdings, Inc.
Canada Goose Holdings Inc.
Stitch Fix, Inc.
Revolve Group, Inc.
Purple Innovation, Inc.
The Loves ac Company
Casper Sleep Inc.
Average
Median
Aggregate Average
Aggregate Median
Stock
Price
$322.65
207.01
214.00
3.79
42.59
18.55
$340.66
56.97
29.32
51.72
22.79
23.89
19.59
20.82
30.53
9.26
Source(s): Capital IQ as of 09/25/20.
¹Multiples larger than 100.0x and less than 0.0x deemed not meaningful.
Market Valuation
% 52-Week
High
92.2%
93.9%
62.6%
28.2%
52.3%
88.2%
99.7%
96.1%
92.0%
94.0%
50.3%
78.5%
73.4%
75.0%
82.8%
58.4%
Market
Cap ($M)
$180,459
74,523
12.051
2,892
1,343
941
$32,496
22,877
9,957
4,500
2.510
2,450
1,362
1,111
443
372
Enterprise
Value
$1 63,747
75,636
11,688
11,766
1,316
1,017
$32,105
22,723
9,791
4,662
2.660
2,233
1,235
1,053
388
339
CY2020
5.0x
5.6x
1.9x
2.3x
3.0x
3.5x
3.5x
3.2x
2.3x
3.3x
6.4x
4.6x
4.6x
1.2x
2.1x
1.7x
1.3x
0.7x
2.8x
2,2x
3.5x
2.5x
EV/Revenue
CY2021
4,6x
4.7x
1.6x
2.4x
2.1x
3.3x
3.1x
2.8x
2.1x
2.7x
4.8x
4.0x
3.5x
1.0x
1.7x
1.3x
1.1x
Q.5x
2.3x
1.9x
2.7x
2.1x
Valuation Metrics¹
CY2022
4.3x
4,4x
1.5x
NM
NM
3.1x
3.3x
3.7x
1.7x
2.3x
3.9x
3.7x
3.2x
09x
1.4x
1.2x
09x
04x
2.0x
1.6x
2.5x
1.9x
CY2020
21.5x
33.9x
201x
65.2x
36.1 x
16.4x
32.2x
27.7x
51.7x
NM
NM
21.9x
19.0x
NM
22.9x
12.9x
NM
NM
25.7x
21.9x
24.8x
19.6x
EVÆEBITDA
CY2021
19.2x
20,2x
10.3x
14.1x
12.9x
14.3x
15.2x
14.2x
59.1 x
NM
NM
18.7x
11.3x
NM
16.9x
11.0x
35.0x
NM
25.3x
17.8x
15.4x
13.8x
CY2022
17.8x
19.1x
9.6x
NM
NM
13.1x
14.9x
155x
37.7x
77.1x
69.1 x
16.9x
10.9x
30.7x
12.7x
100x
15.0x
16.9x
29.7x
16.9x
17.7x
12.7x
Growth Profile (CAGR)
CY2019-CY 2021
EBITDA
Revenue
2.9%
0.7%
(0.2%)
(23.0%)
(6.0%)
6.7%
(3.1%)
0.3%
30.9%
31.2%
40.7%
12.9%
1.4%
11.2%
9.9%
35.8%
24.4%
19.9%
21.8%
22.1%
7.9%
3.3%
6.0%
(0.2%)
(3.7%)
(22.3%)
(6.7%)
16.6%
(1.7%)
(2.0%)
138.5%
161.7%
107.6%
20.7%
101%
(151.6%)
15.1%
77.2%
180.6%
83.6%
64.3%
80.4%
21.4%
2.9%
Margin Profile
EBITDA Margin
CY2020
23.2%
16.4%
9.6%
3.6%
8.2%
21.3%
13.7%
13.0%
4.5%
0.2%
(5.2%)
20.8%
24.0%
(3.1%)
9.0%
12.8%
0.2%
(10.8%)
5.2%
2.4%
7.8%
8.7%
CY2021
24.0%
23.2%
15.4%
16.8%
16.2%
23.0%
19.8%
19.9%
3.5%
1.9%
1.3%
21.4%
30.8%
(0.1%)
101%
12.1%
3.1%
(3.5%)
8.1%
3.3%
14.3%
15.2%View entire presentation