Solar Industry Update
•
NREL Utility-Scale & Residential PV-
Only MMP Benchmarks, 2020-2023
•
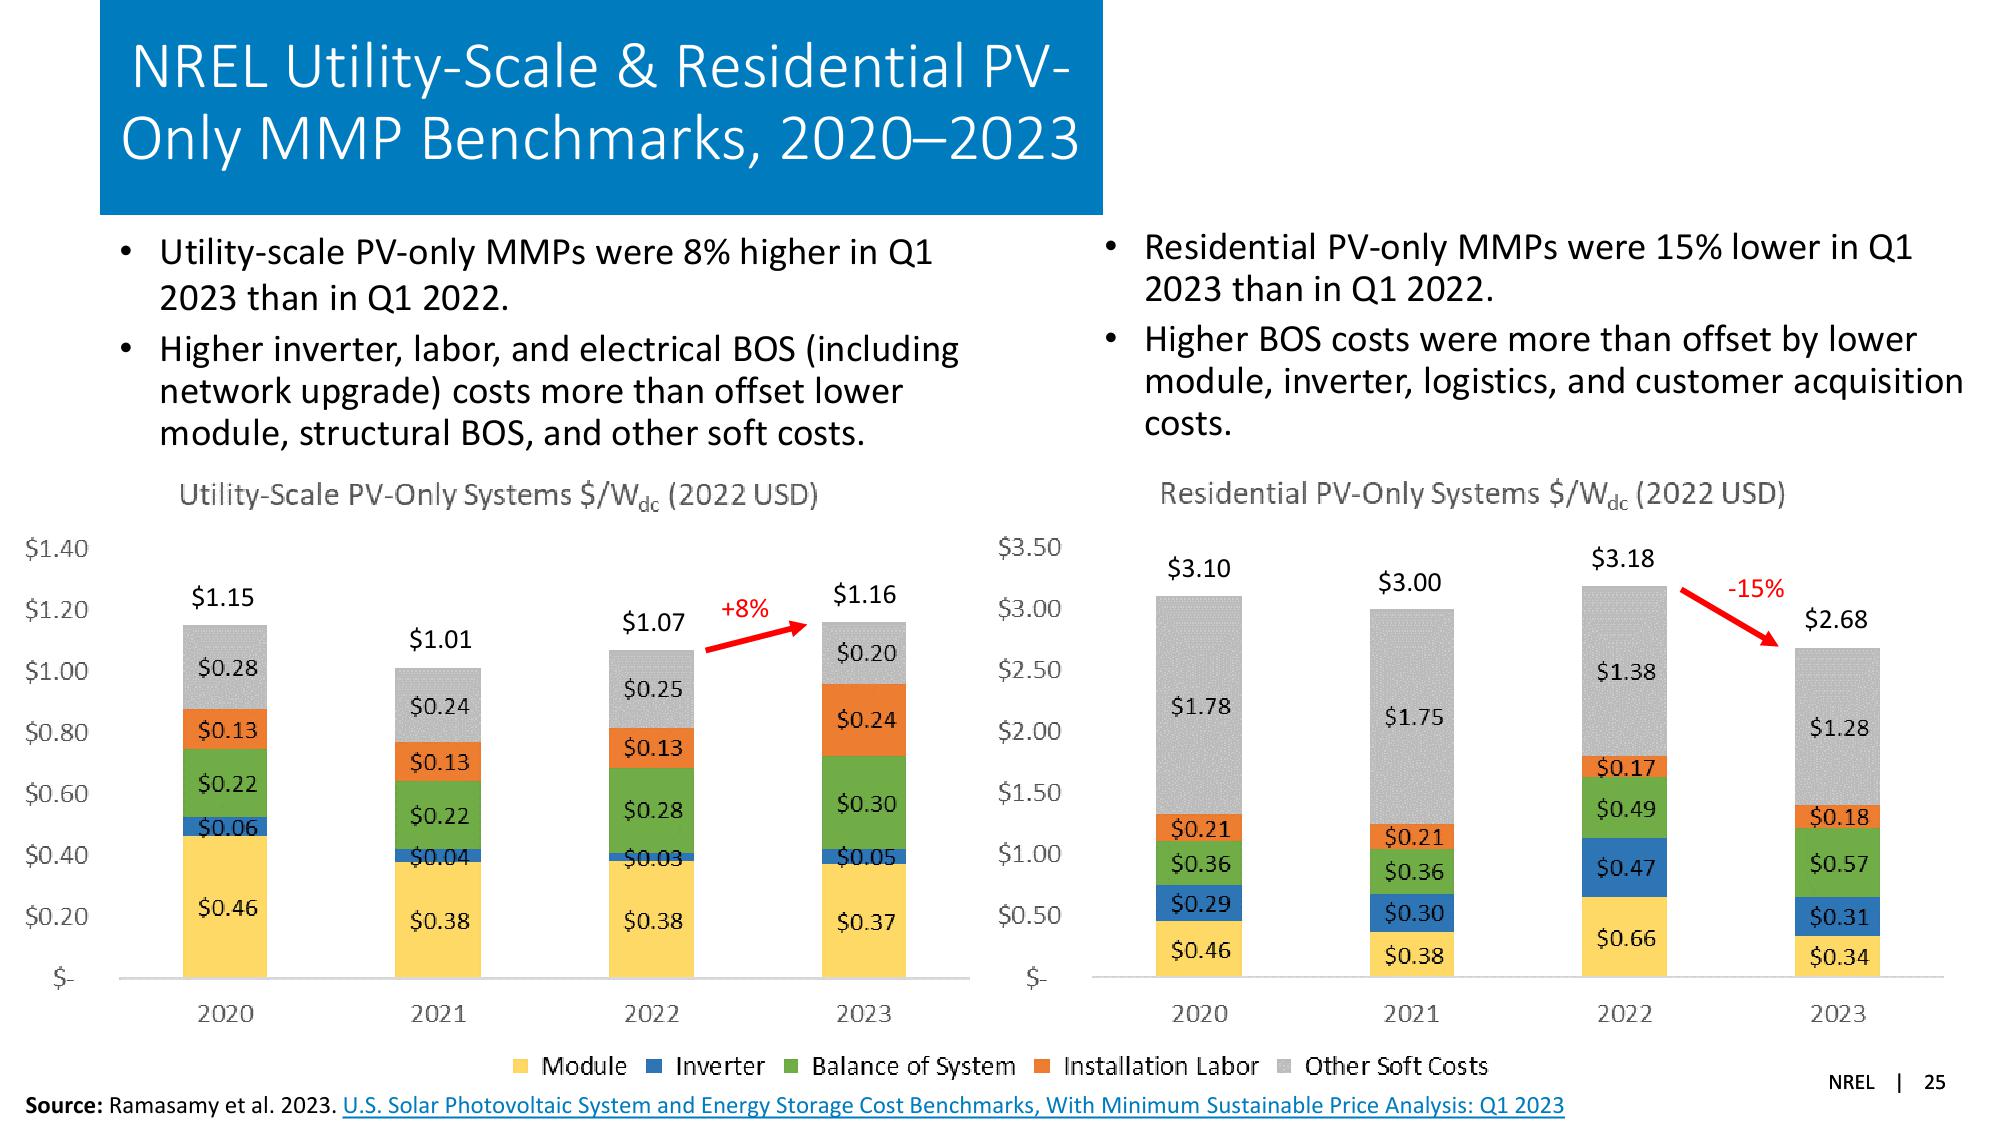
Utility-scale PV-only MMPs were 8% higher in Q1
2023 than in Q1 2022.
Higher inverter, labor, and electrical BOS (including
network upgrade) costs more than offset lower
module, structural BOS, and other soft costs.
Utility-Scale PV-Only Systems $/Wdc (2022 USD)
•
Residential PV-only MMPs were 15% lower in Q1
2023 than in Q1 2022.
Higher BOS costs were more than offset by lower
module, inverter, logistics, and customer acquisition
costs.
Residential PV-Only Systems $/Wdc (2022 USD)
$1.40
$3.50
$3.10
$1.15
$1.16
$3.00
$1.20
+8%
$3.00
$1.07
$3.18
-15%
$2.68
$1.01
$0.20
$1.00
$0.28
$2.50
$1.38
$0.25
$0.24
$1.78
$0.24
$1.75
$0.80
$0.13
$2.00
$1.28
$0.13
$0.13
$0.17
$0.60
$0.22
$0.22
$0.28
$0.30
$1.50
$0.49
$0.18
$0.06
$0.21
$0.21
$0.40
$0.04
$0.03
$0.05
$1.00
$0.36
$0.36
$0.47
$0.57
$0.46
$0.29
$0.20
$0.38
$0.38
$0.37
$0.50
$0.30
$0.31
$0.66
$0.46
$0.38
$0.34
$-
2020
2021
2023
2020
2021
2022
2023
2022
Module
Inverter ■Balance of System Installation Labor Other Soft Costs
Source: Ramasamy et al. 2023. U.S. Solar Photovoltaic System and Energy Storage Cost Benchmarks, With Minimum Sustainable Price Analysis: Q1 2023
NREL 25View entire presentation