Azure Power Investor Presentation
2Q FY'21 Key Performance Metrics
Azure Power
$
$
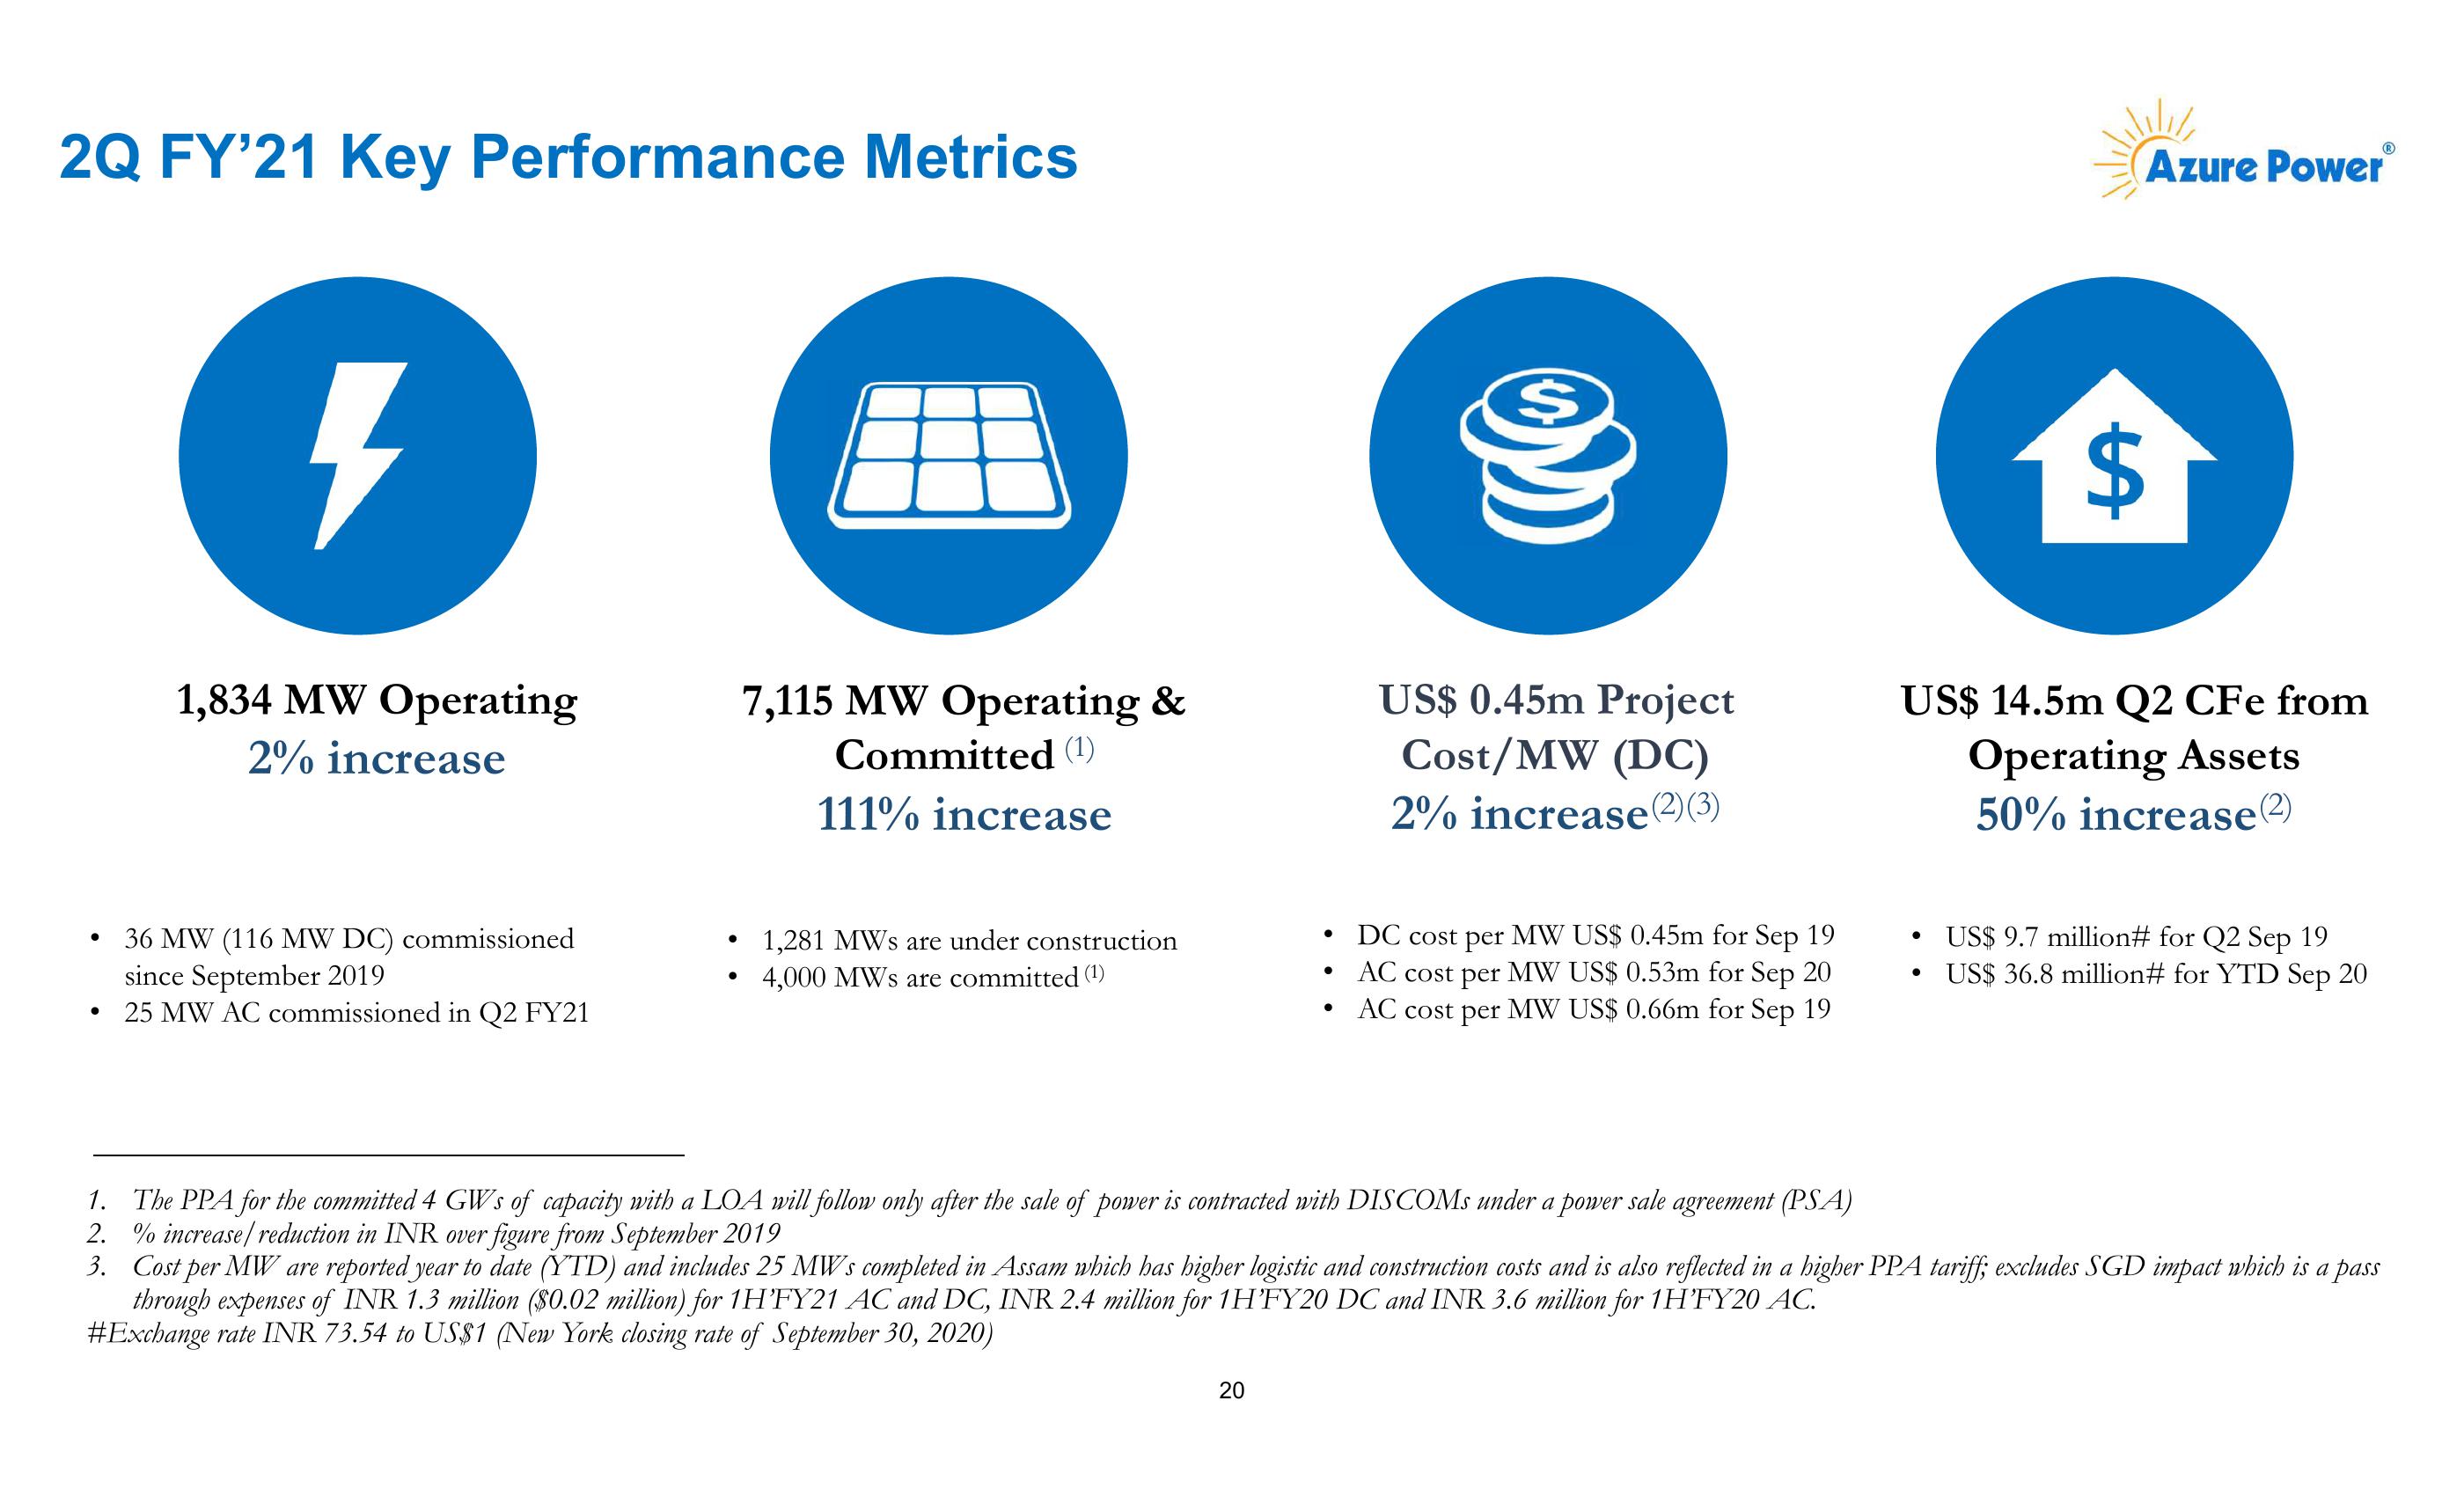
1,834 MW Operating
2% increase
7,115 MW Operating &
Committed (1)
111% increase
US$ 0.45m Project
Cost/MW (DC)
2% increase(2)(3)
US$ 14.5m Q2 CFe from
Operating Assets
50% increase (2)
US$ 9.7 million# for Q2 Sep 19
• US$ 36.8 million# for YTD Sep 20
36 MW (116 MW DC) commissioned
since September 2019
•
1,281 MWs are under construction
•
DC cost per MW US$ 0.45m for Sep 19
•
•
4,000 MWs are committed (1)
.
AC cost per MW US$ 0.53m for Sep 20
•
25 MW AC commissioned in Q2 FY21
•
AC cost per MW US$ 0.66m for Sep 19
1.
The PPA for the committed 4 GWs of capacity with a LOA will follow only after the sale of power is contracted with DISCOMs under a power sale agreement (PSA)
2. % increase/reduction in INR over figure from September 2019
3. Cost per MW are reported year to date (YTD) and includes 25 MW's completed in Assam which has higher logistic and construction costs and is also reflected in a higher PPA tariff; excludes SGD impact which is a pass
through expenses of INR 1.3 million ($0.02 million) for 1H'FY21 AC and DC, INR 2.4 million for 1H’FY20 DC and INR 3.6 million for 1H’FY20 AC.
#Exchange rate INR 73.54 to US$1 (New York closing rate of September 30, 2020)
20
20View entire presentation