Asos Results Presentation Deck
© 2022 asos
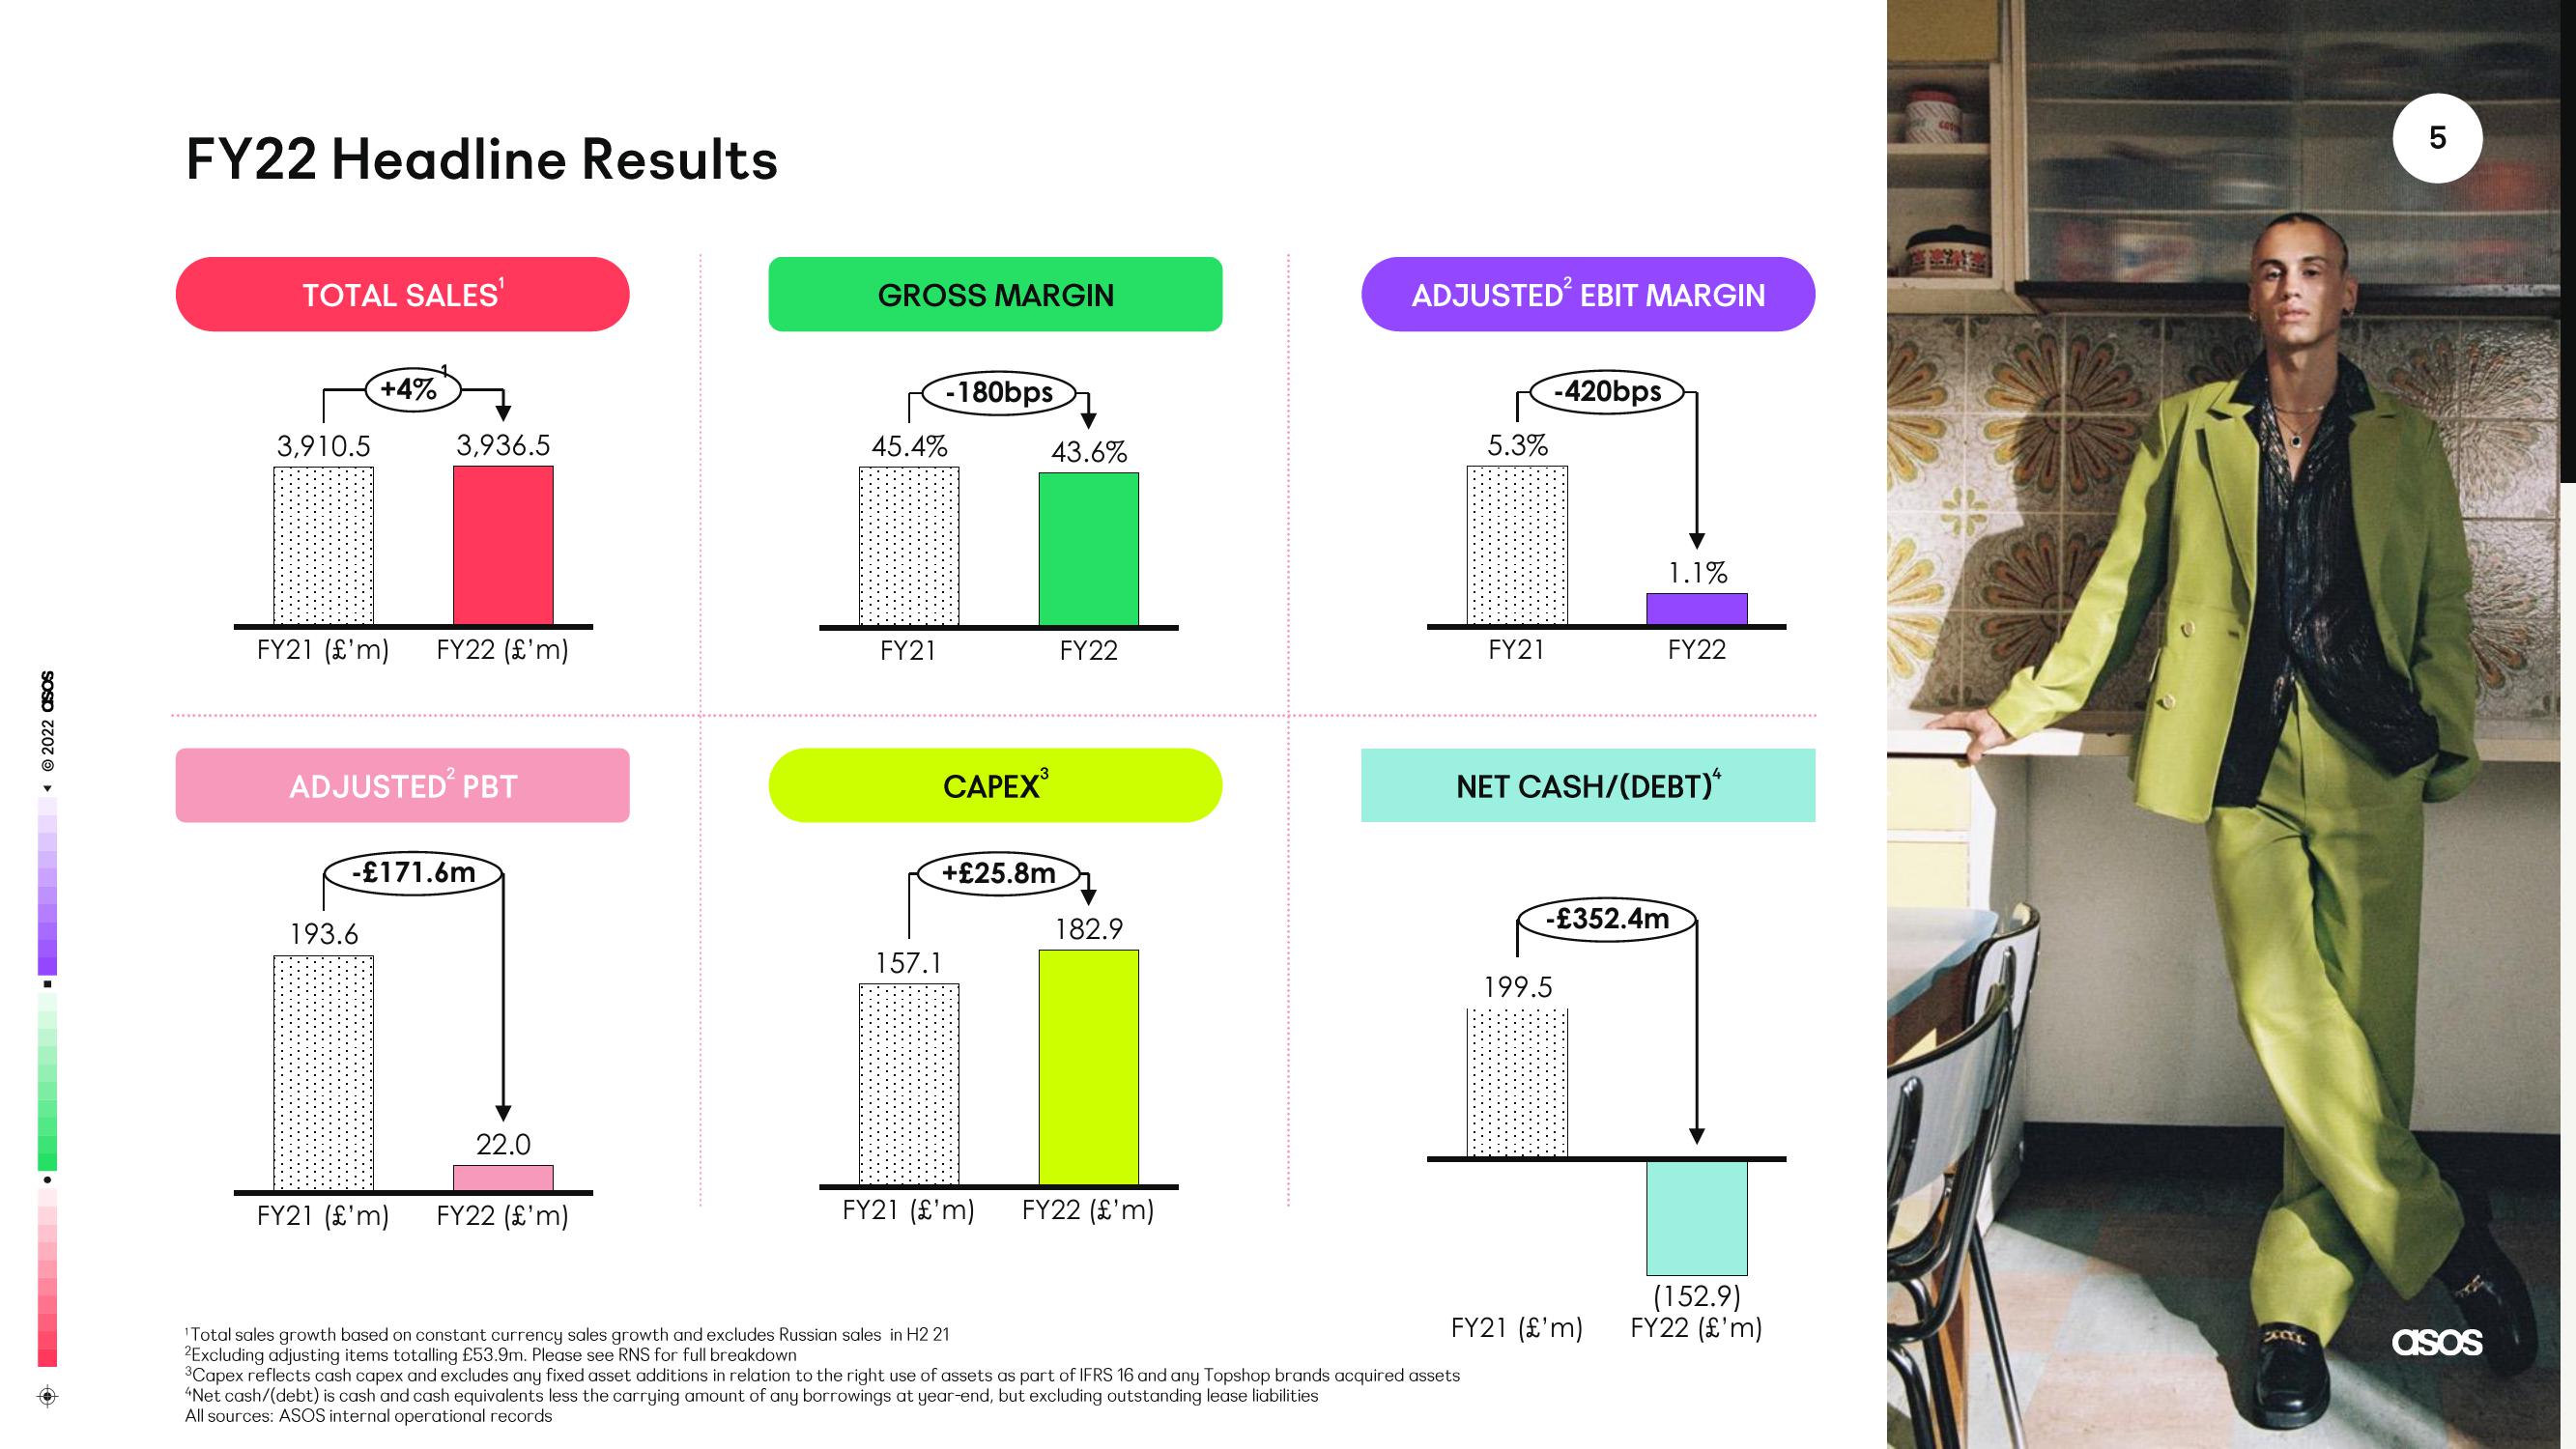
FY22 Headline Results
TOTAL SALES¹
3,910.5
+4%
FY21 (£'m)
193.6
3,936.5
ADJUSTED² PBT
FY22 (£'m)
-£171.6m
FY21 (£'m)
22.0
FY22 (£'m)
GROSS MARGIN
45.4%
FY21
-180bps
157.1
43.6%
CAPEX³
+£25.8m
FY22
182.9
FY21 (£'m) FY22 (£'m)
ADJUSTED² EBIT MARGIN
5.3%
FY21
-420bps
NET CASH/(DEBT)"
-£352.4m
199.5
1.1%
FY22
FY21 (£'m)
Total sales growth based on constant currency sales growth and excludes Russian sales in H2 21
2Excluding adjusting items totalling £53.9m. Please see RNS for full breakdown
³Capex reflects cash capex and excludes any fixed asset additions in relation to the right use of assets as part of IFRS 16 and any Topshop brands acquired assets
"Net cash/(debt) is cash and cash equivalents less the carrying amount of any borrowings at year-end, but excluding outstanding lease liabilities
All sources: ASOS internal operational records
(152.9)
FY22 (£'m)
2000L
5
asosView entire presentation