TPG Results Presentation Deck
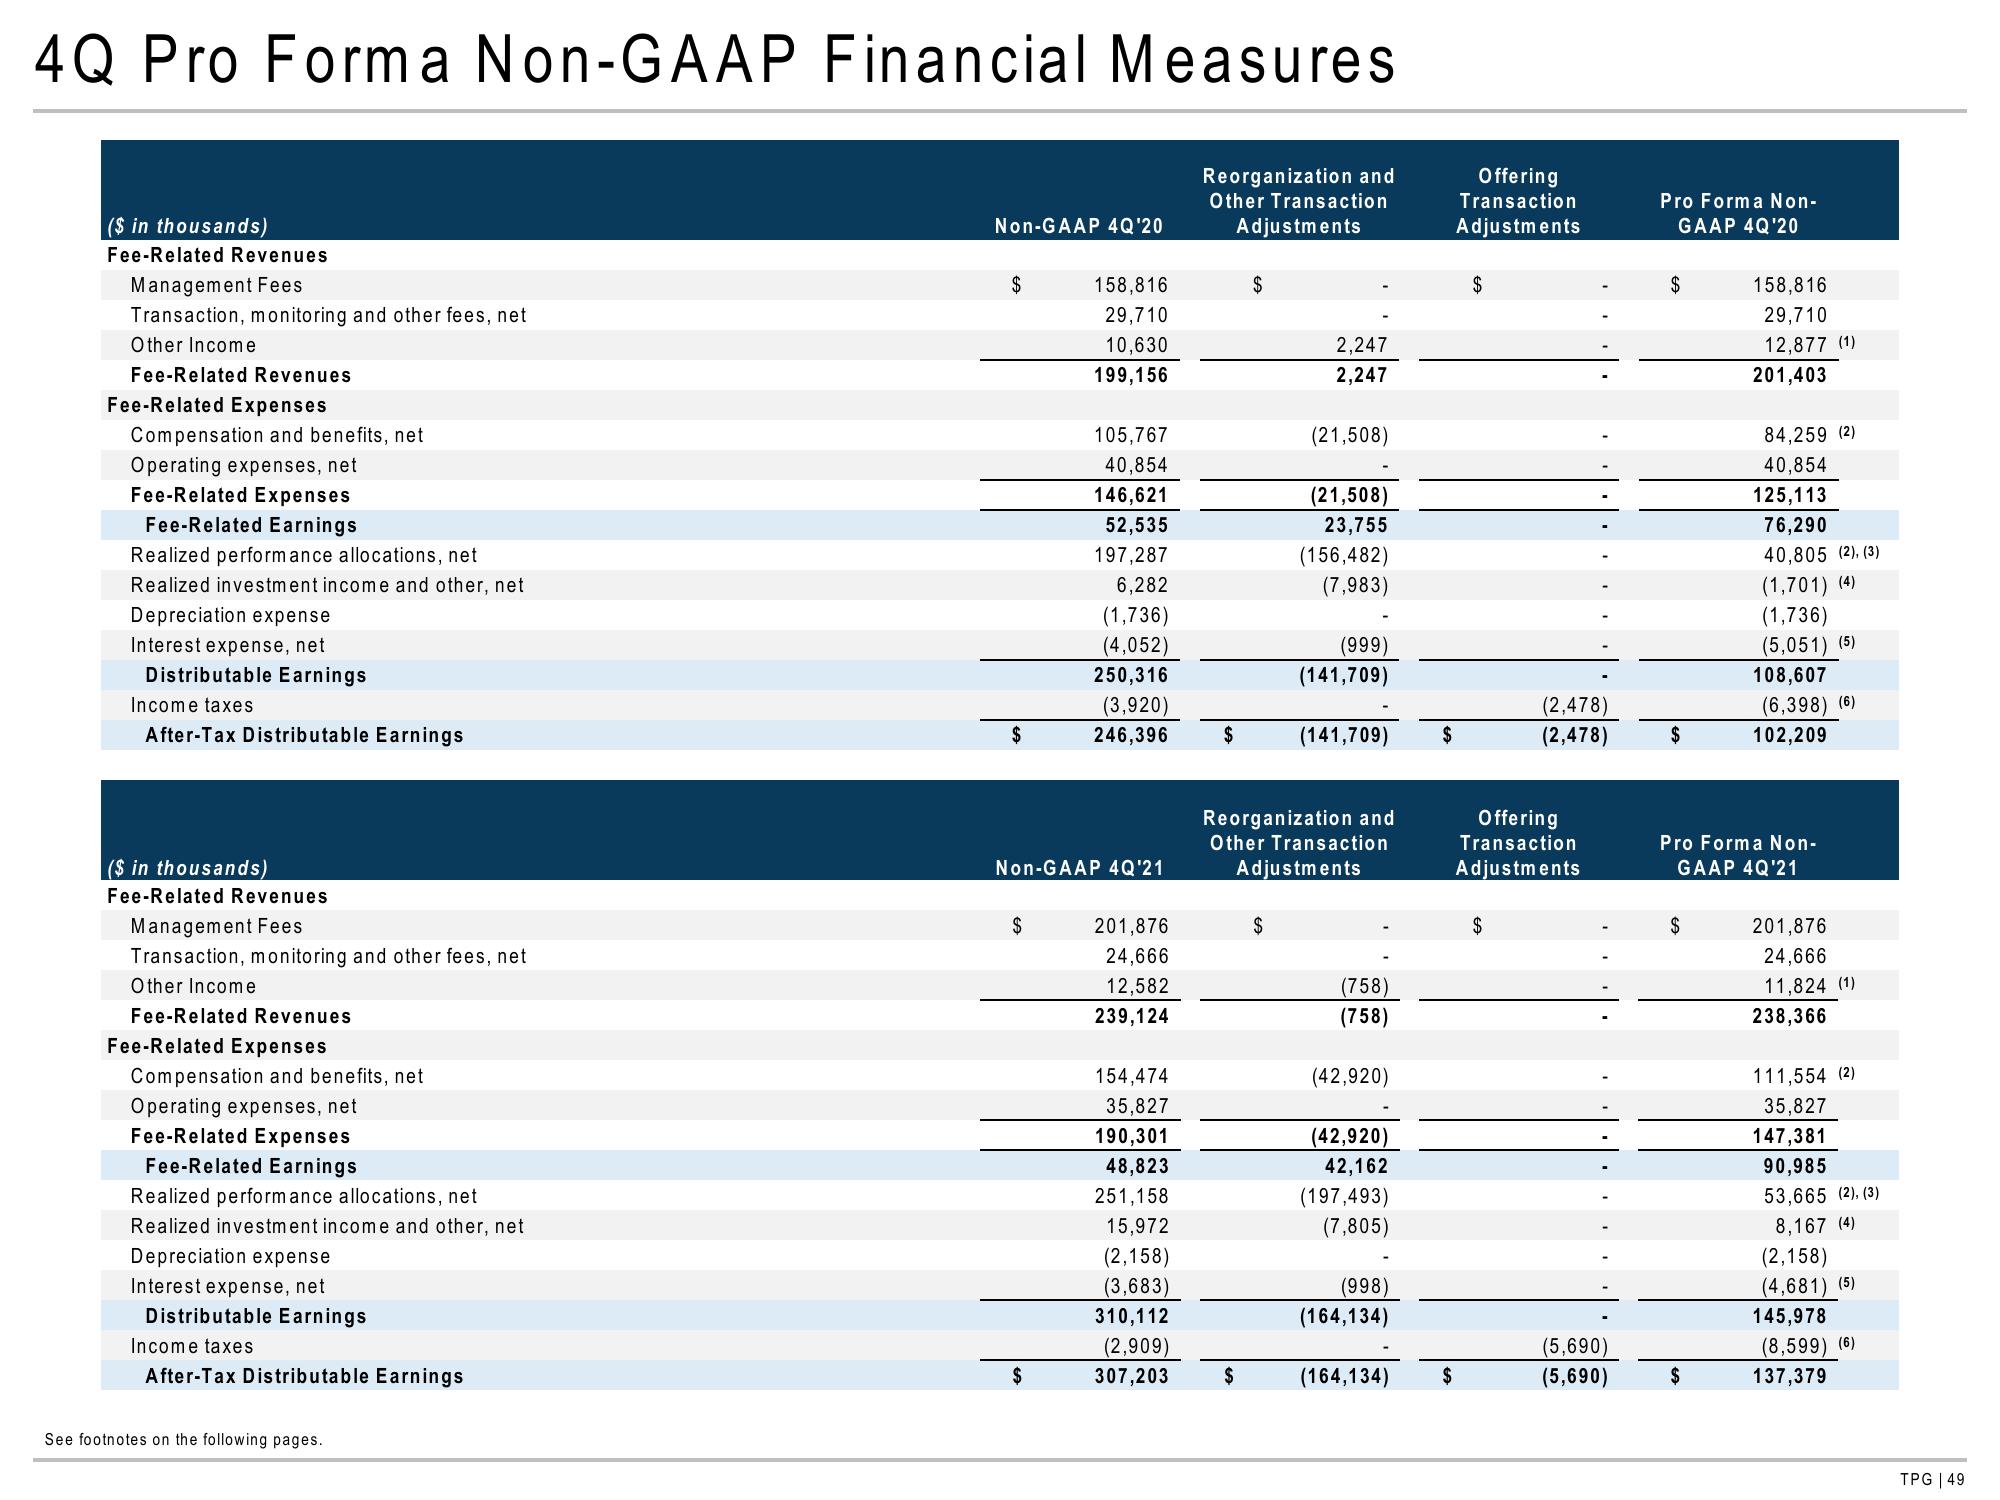
4Q Pro Forma Non-GAAP Financial Measures
Reorganization and
Other Transaction
Adjustments
($ in thousands)
Fee-Related Revenues
Management Fees
Transaction, monitoring and other fees, net
Other Income
Fee-Related Revenues
Fee-Related Expenses
Compensation and benefits, net
Operating expenses, net
Fee-Related Expenses
Fee-Related Earnings
Realized performance allocations, net
Realized investment income and other, net
Depreciation expense
Interest expense, net
Distributable Earnings
Income taxes
After-Tax Distributable Earnings
($ in thousands)
Fee-Related Revenues
Management Fees
Transaction, monitoring and other fees, net
Other Income
Fee-Related Revenues
Fee-Related Expenses
Compensation and benefits, net
Operating expenses, net
Fee-Related Expenses
Fee-Related Earnings
Realized performance allocations, net
Realized investment income and other, net
Depreciation expense
Interest expense,
Distributable Earnings
Income taxes
After-Tax Distributable Earnings
See footnotes on the following pages.
Non-GAAP 4Q'20
$
$
$
158,816
29,710
10,630
199,156
$
105,767
40,854
146,621
52,535
197,287
6,282
(1,736)
(4,052)
250,316
Non-GAAP 4Q'21
(3,920)
246,396
201,876
24,666
12,582
239,124
154,474
35,827
190,301
48,823
251,158
15,972
(2,158)
3,683)
310,112
(2,909)
307,203
$
$
$
2,247
2,247
$
(21,508)
(21,508)
23,755
(156,482)
(7,983)
(999)
(141,709)
Reorganization and
Other Transaction
Adjustments
(141,709)
(758)
(758)
(42,920)
(42,920)
42,162
(197,493)
(7,805)
(998)
(164,134)
(164,134)
$
$
Offering
Transaction
Adjustments
$
(2,478)
(2,478)
Offering
Transaction
Adjustments
$
(5,690)
(5,690)
Pro Forma Non-
GAAP 4Q'20
$
$
$
158,816
29,710
12,877 (1)
201,403
$
84,259 (2)
40,854
125,113
76,290
40,805 (2), (3)
Pro Forma Non-
GAAP 4Q'21
(1,701) (4)
(1,736)
(5,051) (5)
108,607
(6,398) (6)
102,209
201,876
24,666
11,824 (1)
238,366
111,554 (2)
35,827
147,381
90,985
53,665 (2), (3)
8,167 (4)
(2,158)
(4,681) (5)
145,978
(8,599) (6)
137,379
TPG | 49View entire presentation