Factset Results Presentation Deck
Non-GAAP Reconciliations
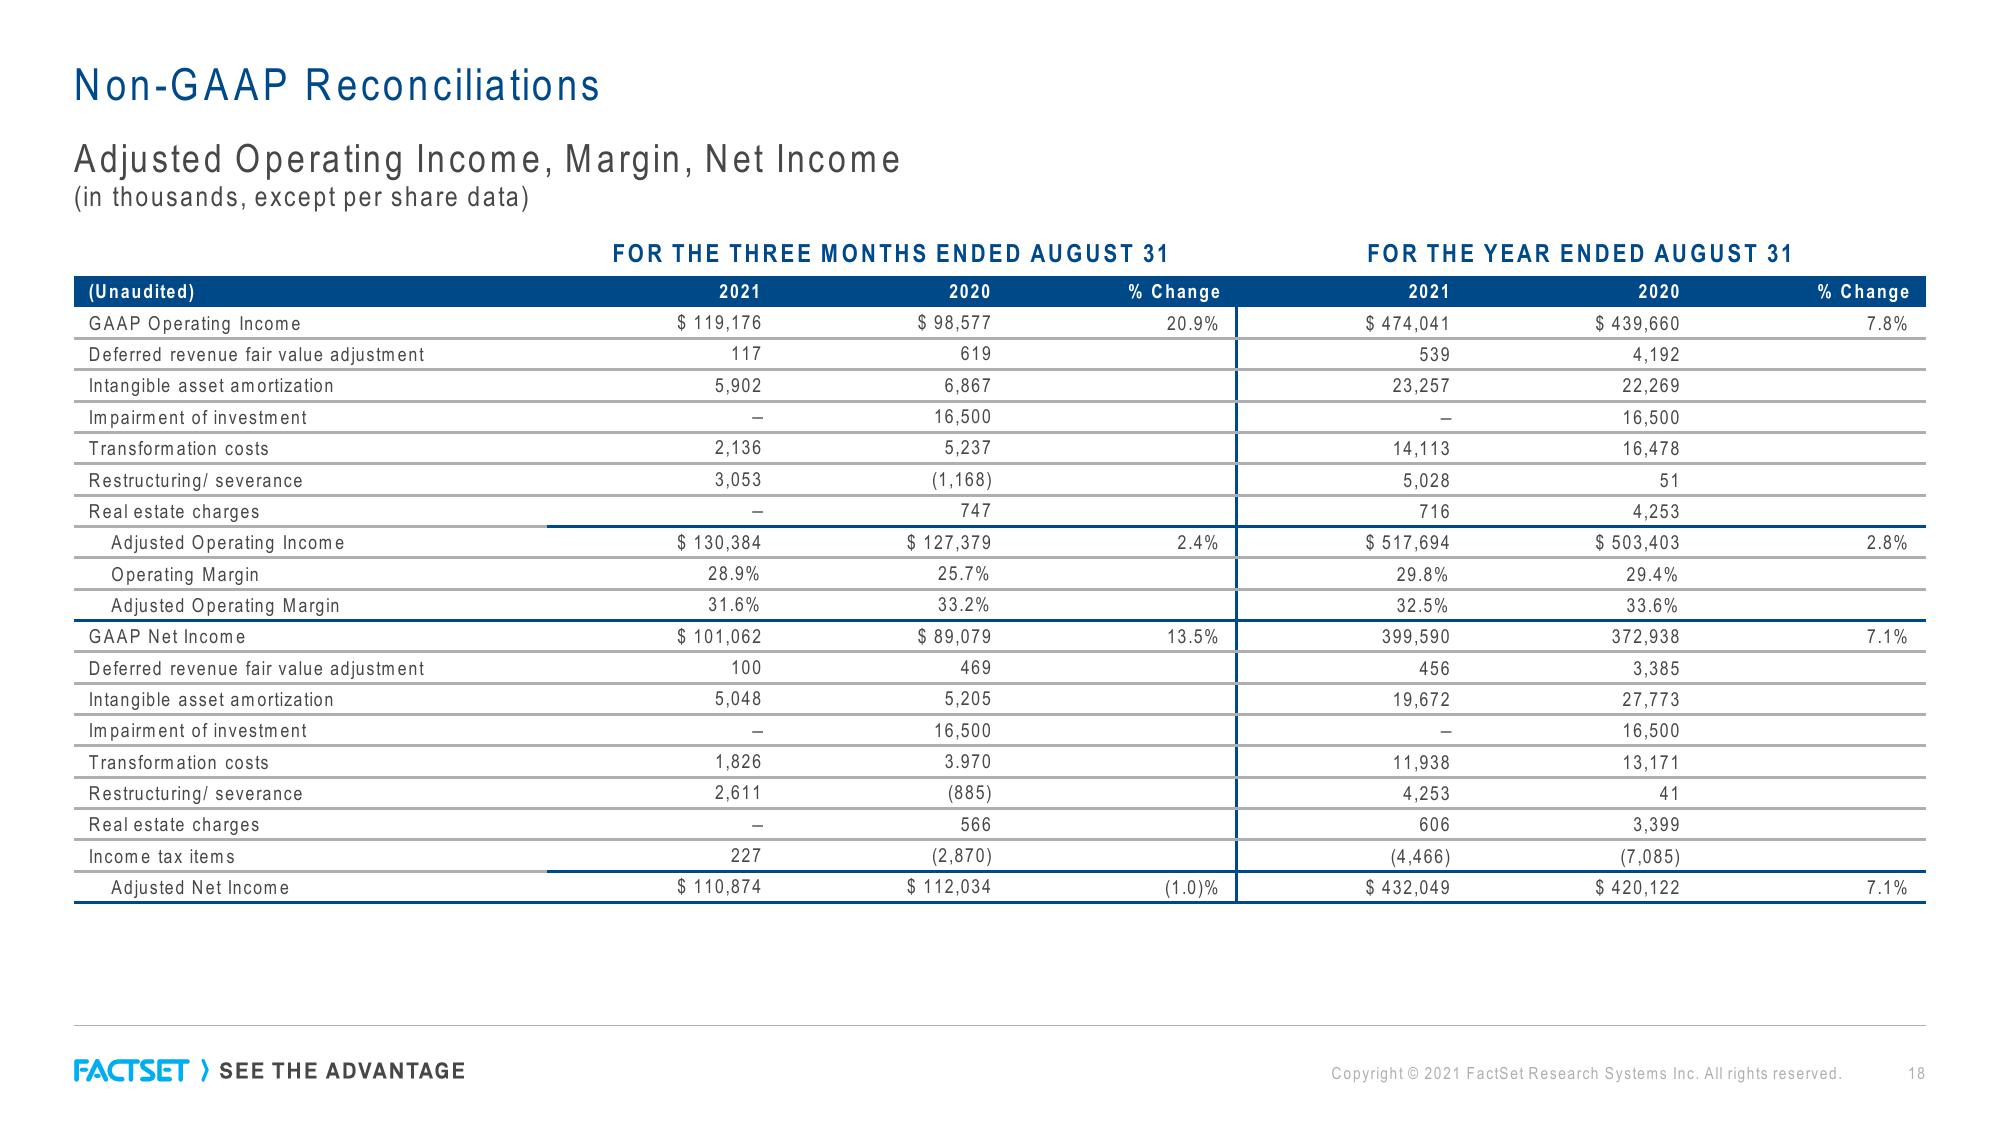
Adjusted Operating Income, Margin, Net Income
(in thousands, except per share data)
(Unaudited)
GAAP Operating Income
Deferred revenue fair value adjustment
Intangible asset amortization
Impairment of investment
Transformation costs.
Restructuring/ severance
Real estate charges
Adjusted Operating Income
Operating Margin
Adjusted Operating Margin
GAAP Net Income
Deferred revenue fair value adjustment
Intangible asset amortization
Impairment of investment.
Transformation costs.
Restructuring/ severance
Real estate charges
Income tax items
Adjusted Net Income
FACTSET > SEE THE ADVANTAGE
FOR THE THREE MONTHS ENDED AUGUST 31
2020
$ 98,577
619
2021
$ 119,176
117
5,902
2,136
3,053
$ 130,384
28.9%
31.6%
$ 101,062
100
5,048
1,826
2,611
227
$ 110,874
6,867
16,500
5,237
(1,168)
747
$ 127,379
25.7%
33.2%
$ 89,079
469
5,205
16,500
3.970
(885)
566
(2,870)
$ 112,034
% Change
20.9%
2.4%
13.5%
(1.0)%
FOR THE YEAR ENDED AUGUST 31
2021
$ 474,041
539
23,257
14,113
5,028
716
$ 517,694
29.8%
32.5%
399,590
456
19,672
11,938
4,253
606
(4,466)
$ 432,049
2020
$ 439,660
4,192
22,269
16,500
16,478
51
4,253
$ 503,403
29.4%
33.6%
372,938
3,385
27,773
16,500
13,171
41
3,399
(7,085)
$ 420,122
% Change
7.8%
Copyright © 2021 FactSet Research Systems Inc. All rights reserved.
2.8%
7.1%
7.1%
18View entire presentation