Ashtead Group Results Presentation Deck
22
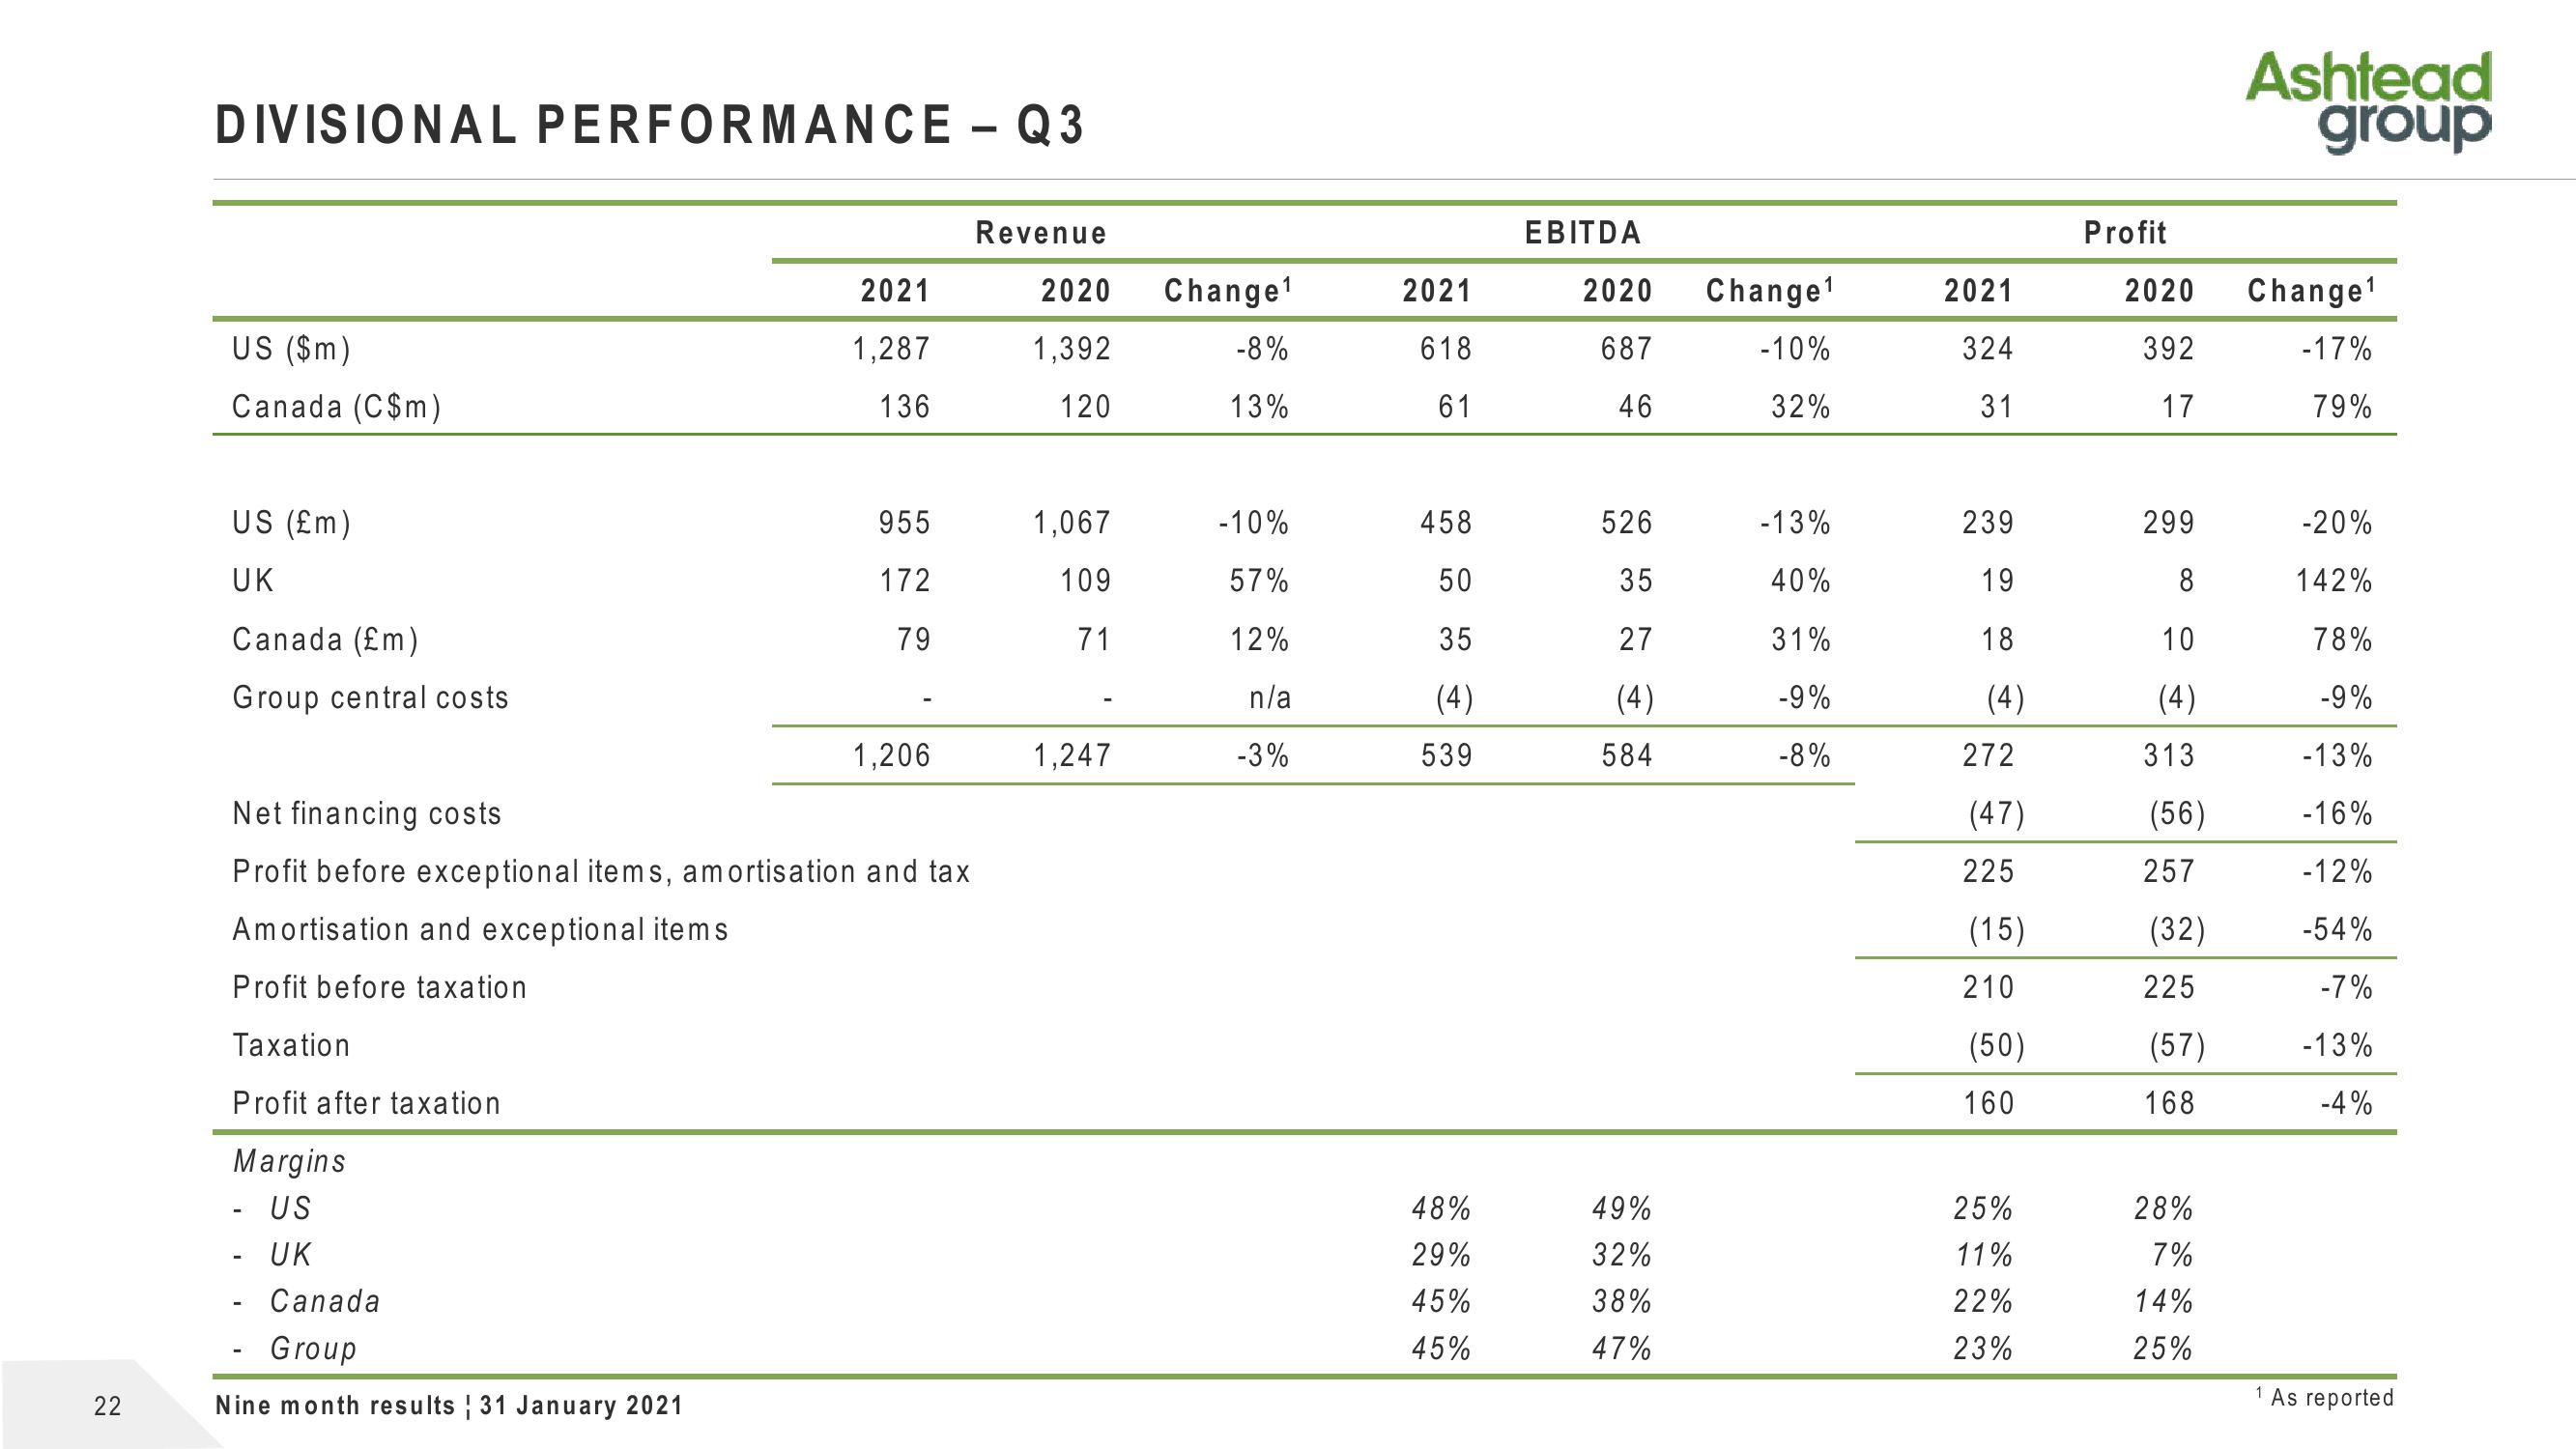
DIVISIONAL PERFORMANCE - Q3
US ($m)
Canada (C$m)
US (£m)
UK
Canada (£m)
Group central costs
Amortisation and exceptional items
Profit before taxation
Taxation
Profit after taxation
Margins
- US
- UK
Canada
2021
1,287
136
Net financing costs
Profit before exceptional items, amortisation and tax
- Group
Nine month results 31 January 2021
955
172
79
1,206
Revenue
2020 Change¹
1,392
120
1,067
109
71
1,247
-8%
13%
-10%
57%
12%
n/a
-3%
2021
618
61
458
50
35
(4)
539
48%
29%
45%
45%
EBITDA
2020 Change¹
687
-10%
46
32%
526
35
27
(4)
584
49%
32%
38%
47%
-13%
40%
31%
-9%
-8%
2021
324
31
239
19
18
(4)
272
(47)
225
(15)
210
(50)
160
25%
11%
22%
23%
Profit
2020 Change¹
392
-17%
17
79%
299
8
10
(4)
313
(56)
257
(32)
225
(57)
168
Ashtead
group
28%
7%
14%
25%
1
-20%
142%
78%
-9%
-13%
-16%
-12%
-54%
-7%
-13%
-4%
As reportedView entire presentation