Nikola Results Presentation Deck
1 2
PAGE
NIKOLA
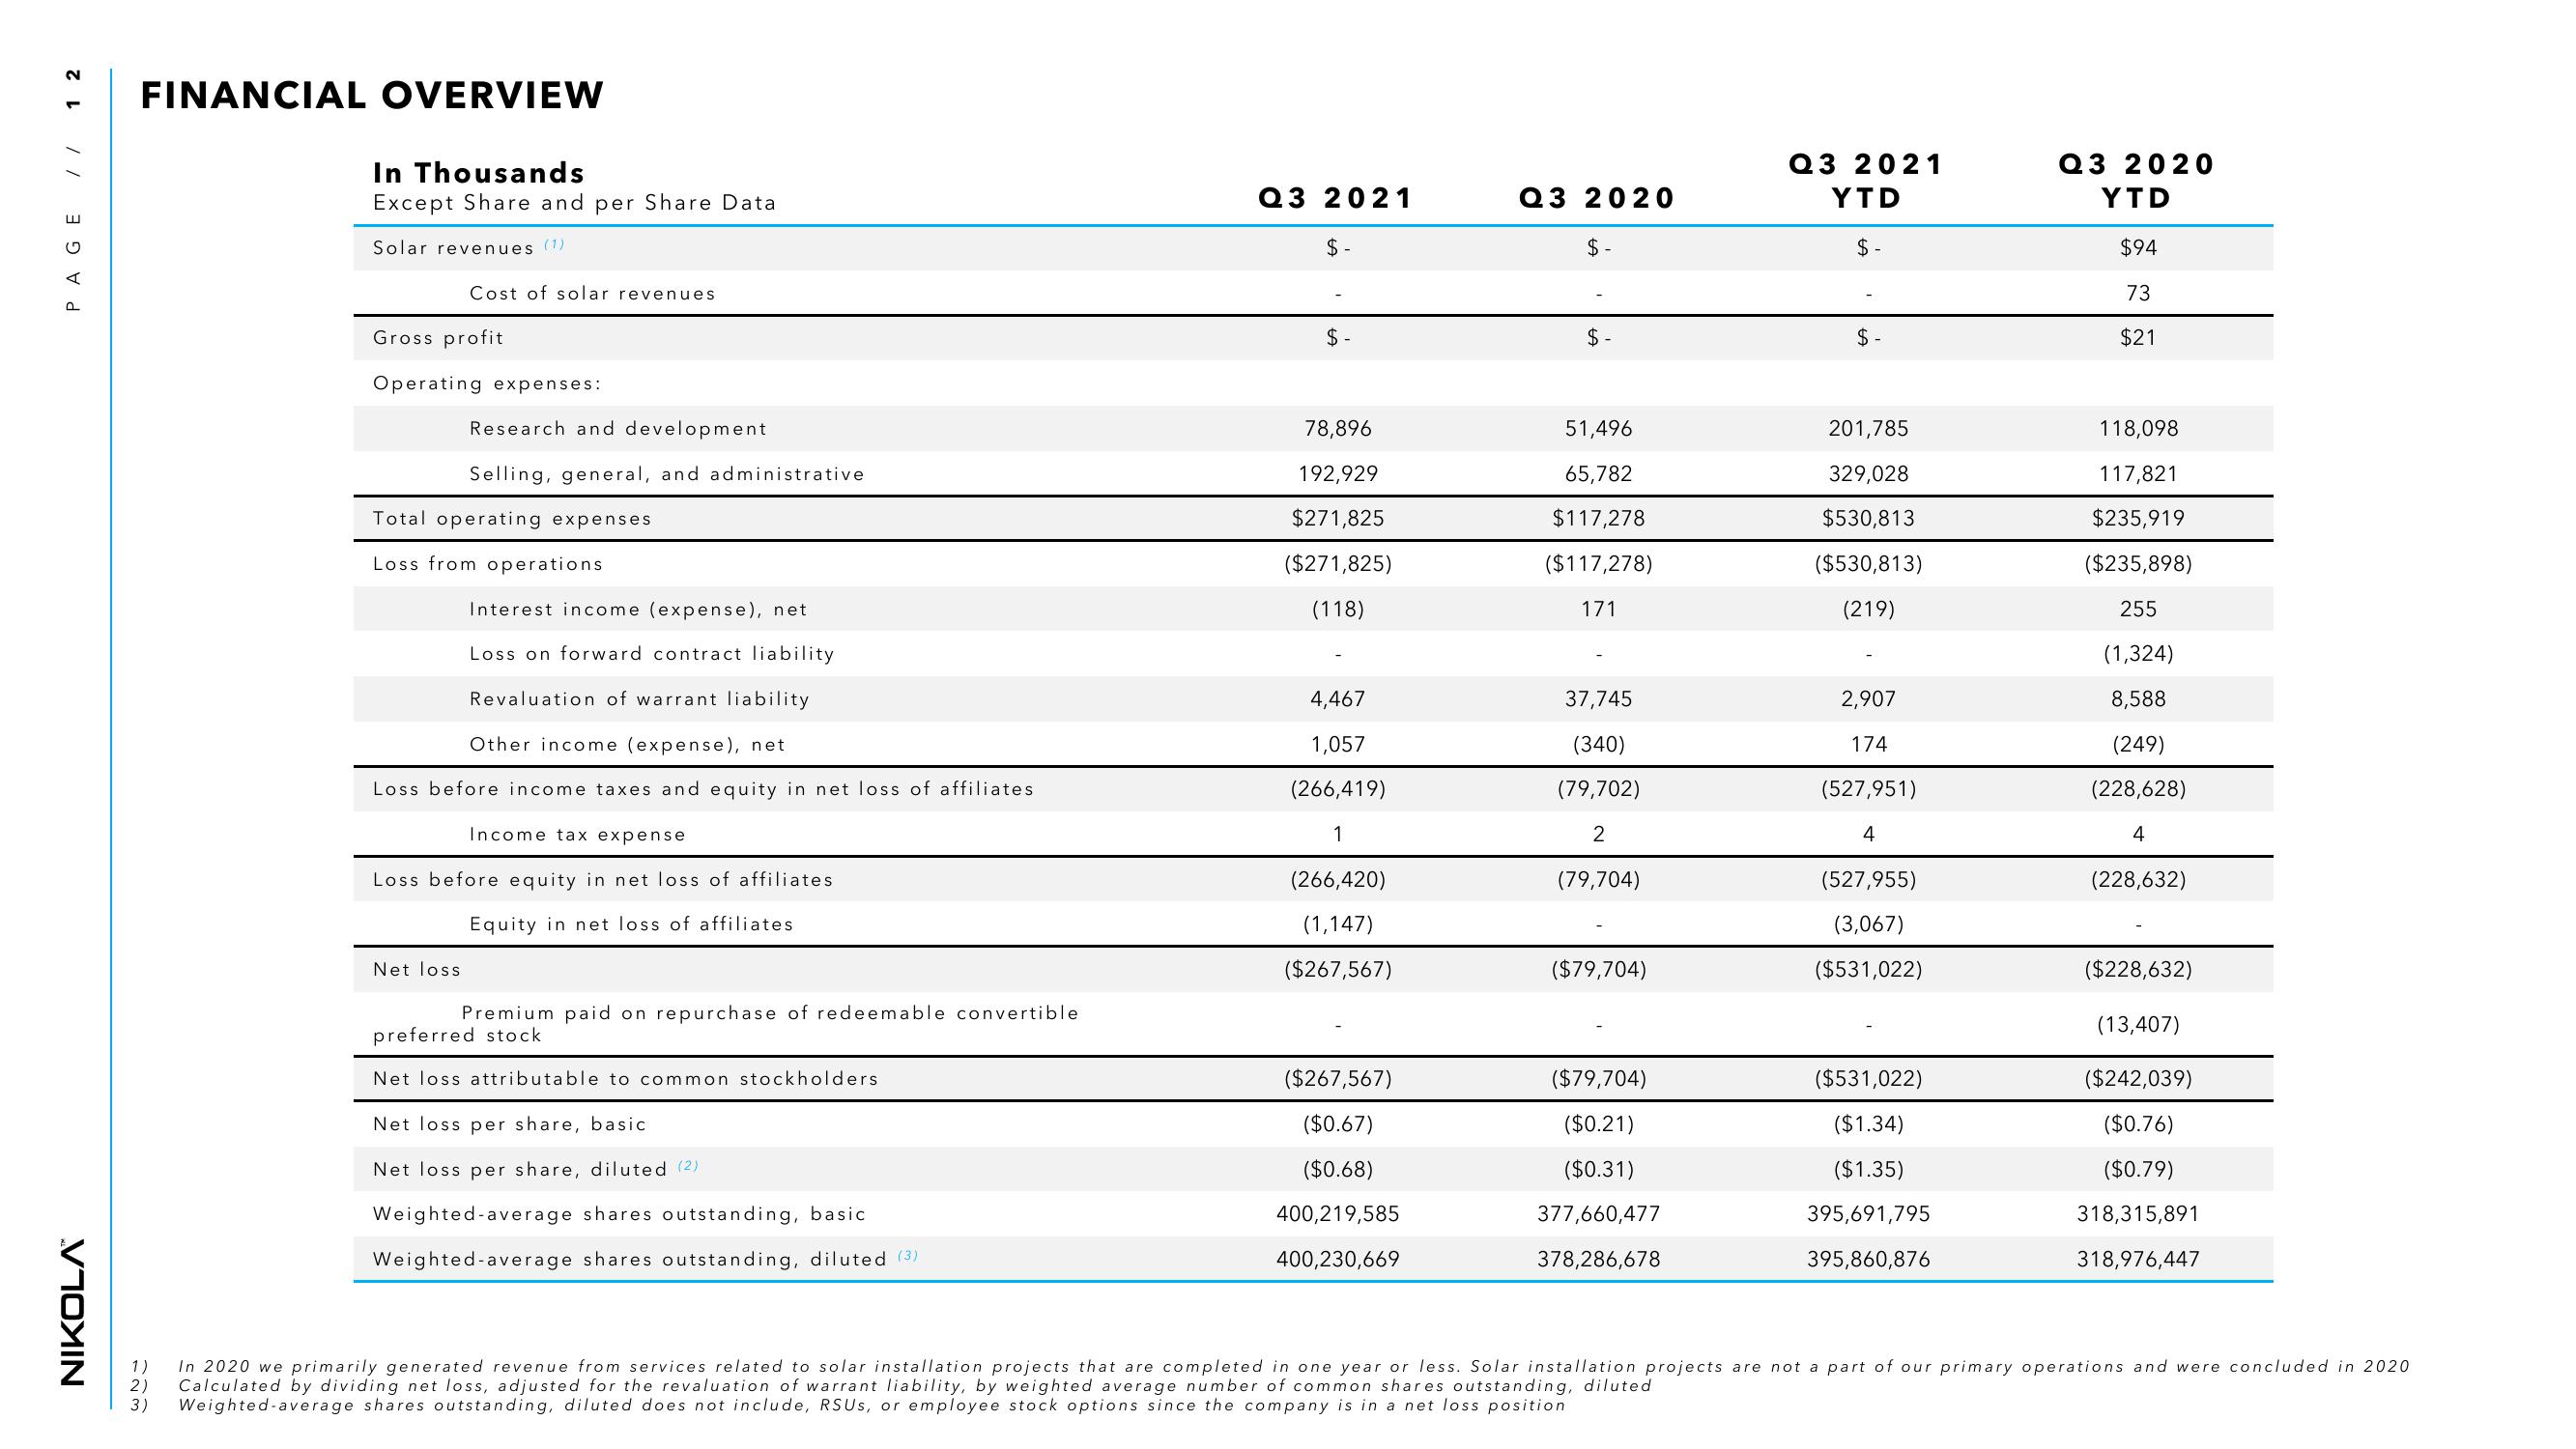
FINANCIAL OVERVIEW
In Thousands
Except Share and per Share Data
Solar revenues (¹)
Cost of solar revenues
Gross profit
Operating expenses:
Research and development
Selling, general, and administrative
Total operating expenses
Loss from operations
Interest income (expense), net
Loss on forward contract liability
Revaluation of warrant liability
Other income (expense), net
Loss before income taxes and equity in net loss of affiliates
Net loss
Income tax expense
Loss before equity in net loss of affiliates
Equity in net loss of affiliates
Premium paid on repurchase of redeemable convertible
preferred stock
Net loss attributable to common stockholders
Net loss per share, basic
Net loss per share, diluted (2)
Weighted-average shares outstanding, basic
Weighted-average shares outstanding, diluted (3)
Q3 2021
$-
$-
78,896
192,929
$271,825
($271,825)
(118)
4,467
1,057
(266,419)
1
(266,420)
(1,147)
($267,567)
($267,567)
($0.67)
($0.68)
400,219,585
400,230,669
Q3 2020
$-
$
51,496
65,782
$117,278
($117,278)
171
37,745
(340)
(79,702)
2
(79,704)
($79,704)
($79,704)
($0.21)
($0.31)
377,660,477
378,286,678
Q3 2021
YTD
$-
$-
201,785
329,028
$530,813
($530,813)
(219)
2,907
174
(527,951)
4
(527,955)
(3,067)
($531,022)
($531,022)
($1.34)
($1.35)
395,691,795
395,860,876
Q3 2020
YTD
$94
73
$21
118,098
117,821
$235,919
($235,898)
255
(1,324)
8,588
(249)
(228,628)
4
(228,632)
($228,632)
(13,407)
($242,039)
($0.76)
($0.79)
318,315,891
318,976,447
1) In 2020 we primarily generated revenue from services related to solar installation projects that are completed in one year or less. Solar installation projects are not a part of our primary operations and were concluded in 2020
2) Calculated by dividing net loss, adjusted for the revaluation of warrant liability, by weighted average number of common shares outstanding, diluted
3)
Weighted-average shares outstanding, diluted does not include, RSUS, or employee stock options since the company is in a net loss positionView entire presentation