Kering Investor Presentation Deck
- REVENUE
(in €m, and comparable growth in %)
919
H1 2020
●
% comp.
+63%
W. Europe
N. America
Japan
APAC
ROW
Total
Retail
+67%
Retail (56% of H1 sales)
Q2
H1
+55%
+377%
+101%
+87%
+375%
+108%
Wholesale
+51%
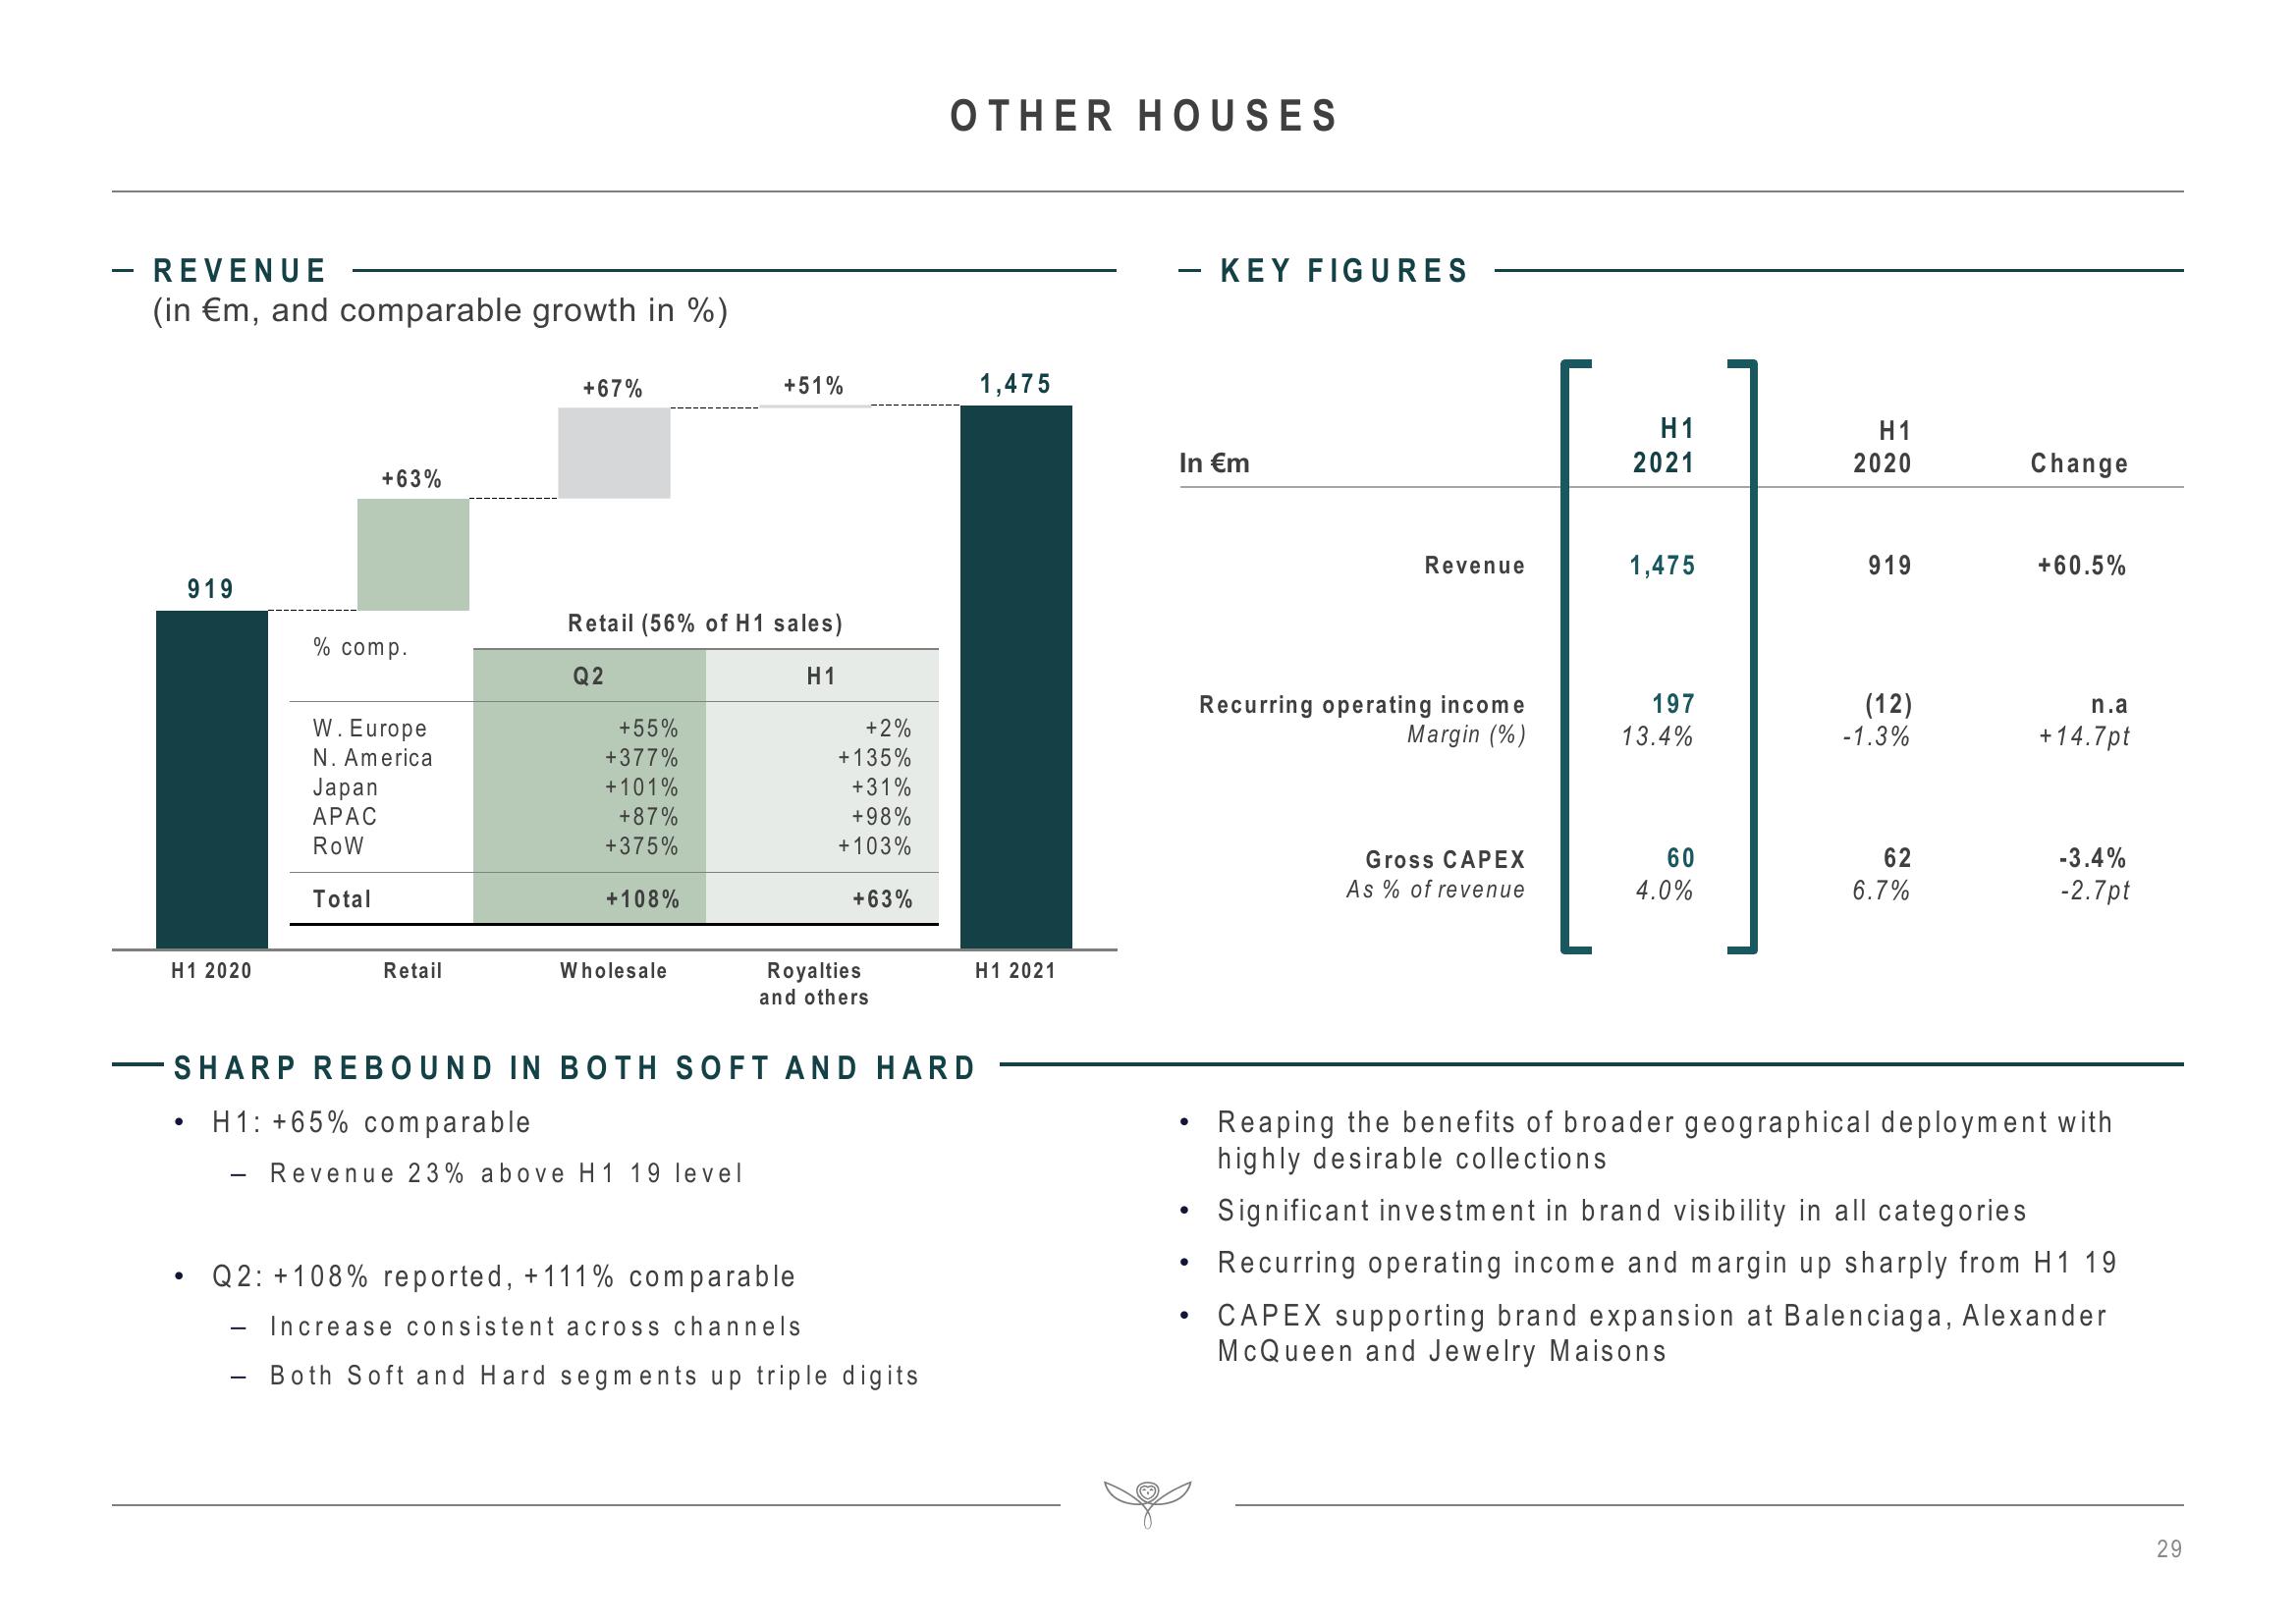
Revenue 23% above H 1 19 level
+2%
+135%
+31%
+98%
+ 103%
+63%
Royalties
and others
SHARP REBOUND IN BOTH SOFT AND HARD
H1: +65% comparable
OTHER HOUSES
Q2: +108% reported, +111% comparable
Increase consistent across channels
- Both Soft and Hard segments up triple digits
1,475
H1 2021
- KEY FIGURES
In €m
●
●
●
●
Revenue
Recurring operating income
Margin (%)
Gross CAPEX
As % of revenue
H1
2021
1,475
197
13.4%
60
4.0%
H1
2020
919
(12)
-1.3%
62
6.7%
Change
+60.5%
n.a
+14.7pt
-3.4%
-2.7pt
Reaping the benefits of broader geographical deployment with
highly desirable collections
Significant investment in brand visibility in all categories
Recurring operating income and margin up sharply from H1 19
CAPEX supporting brand expansion at Balenciaga, Alexander
McQueen and Jewelry Maisons
29View entire presentation