Pathward Financial Results Presentation Deck
Capital and Sources of Liquidity
Regulatory Capital as of December 31, 2022
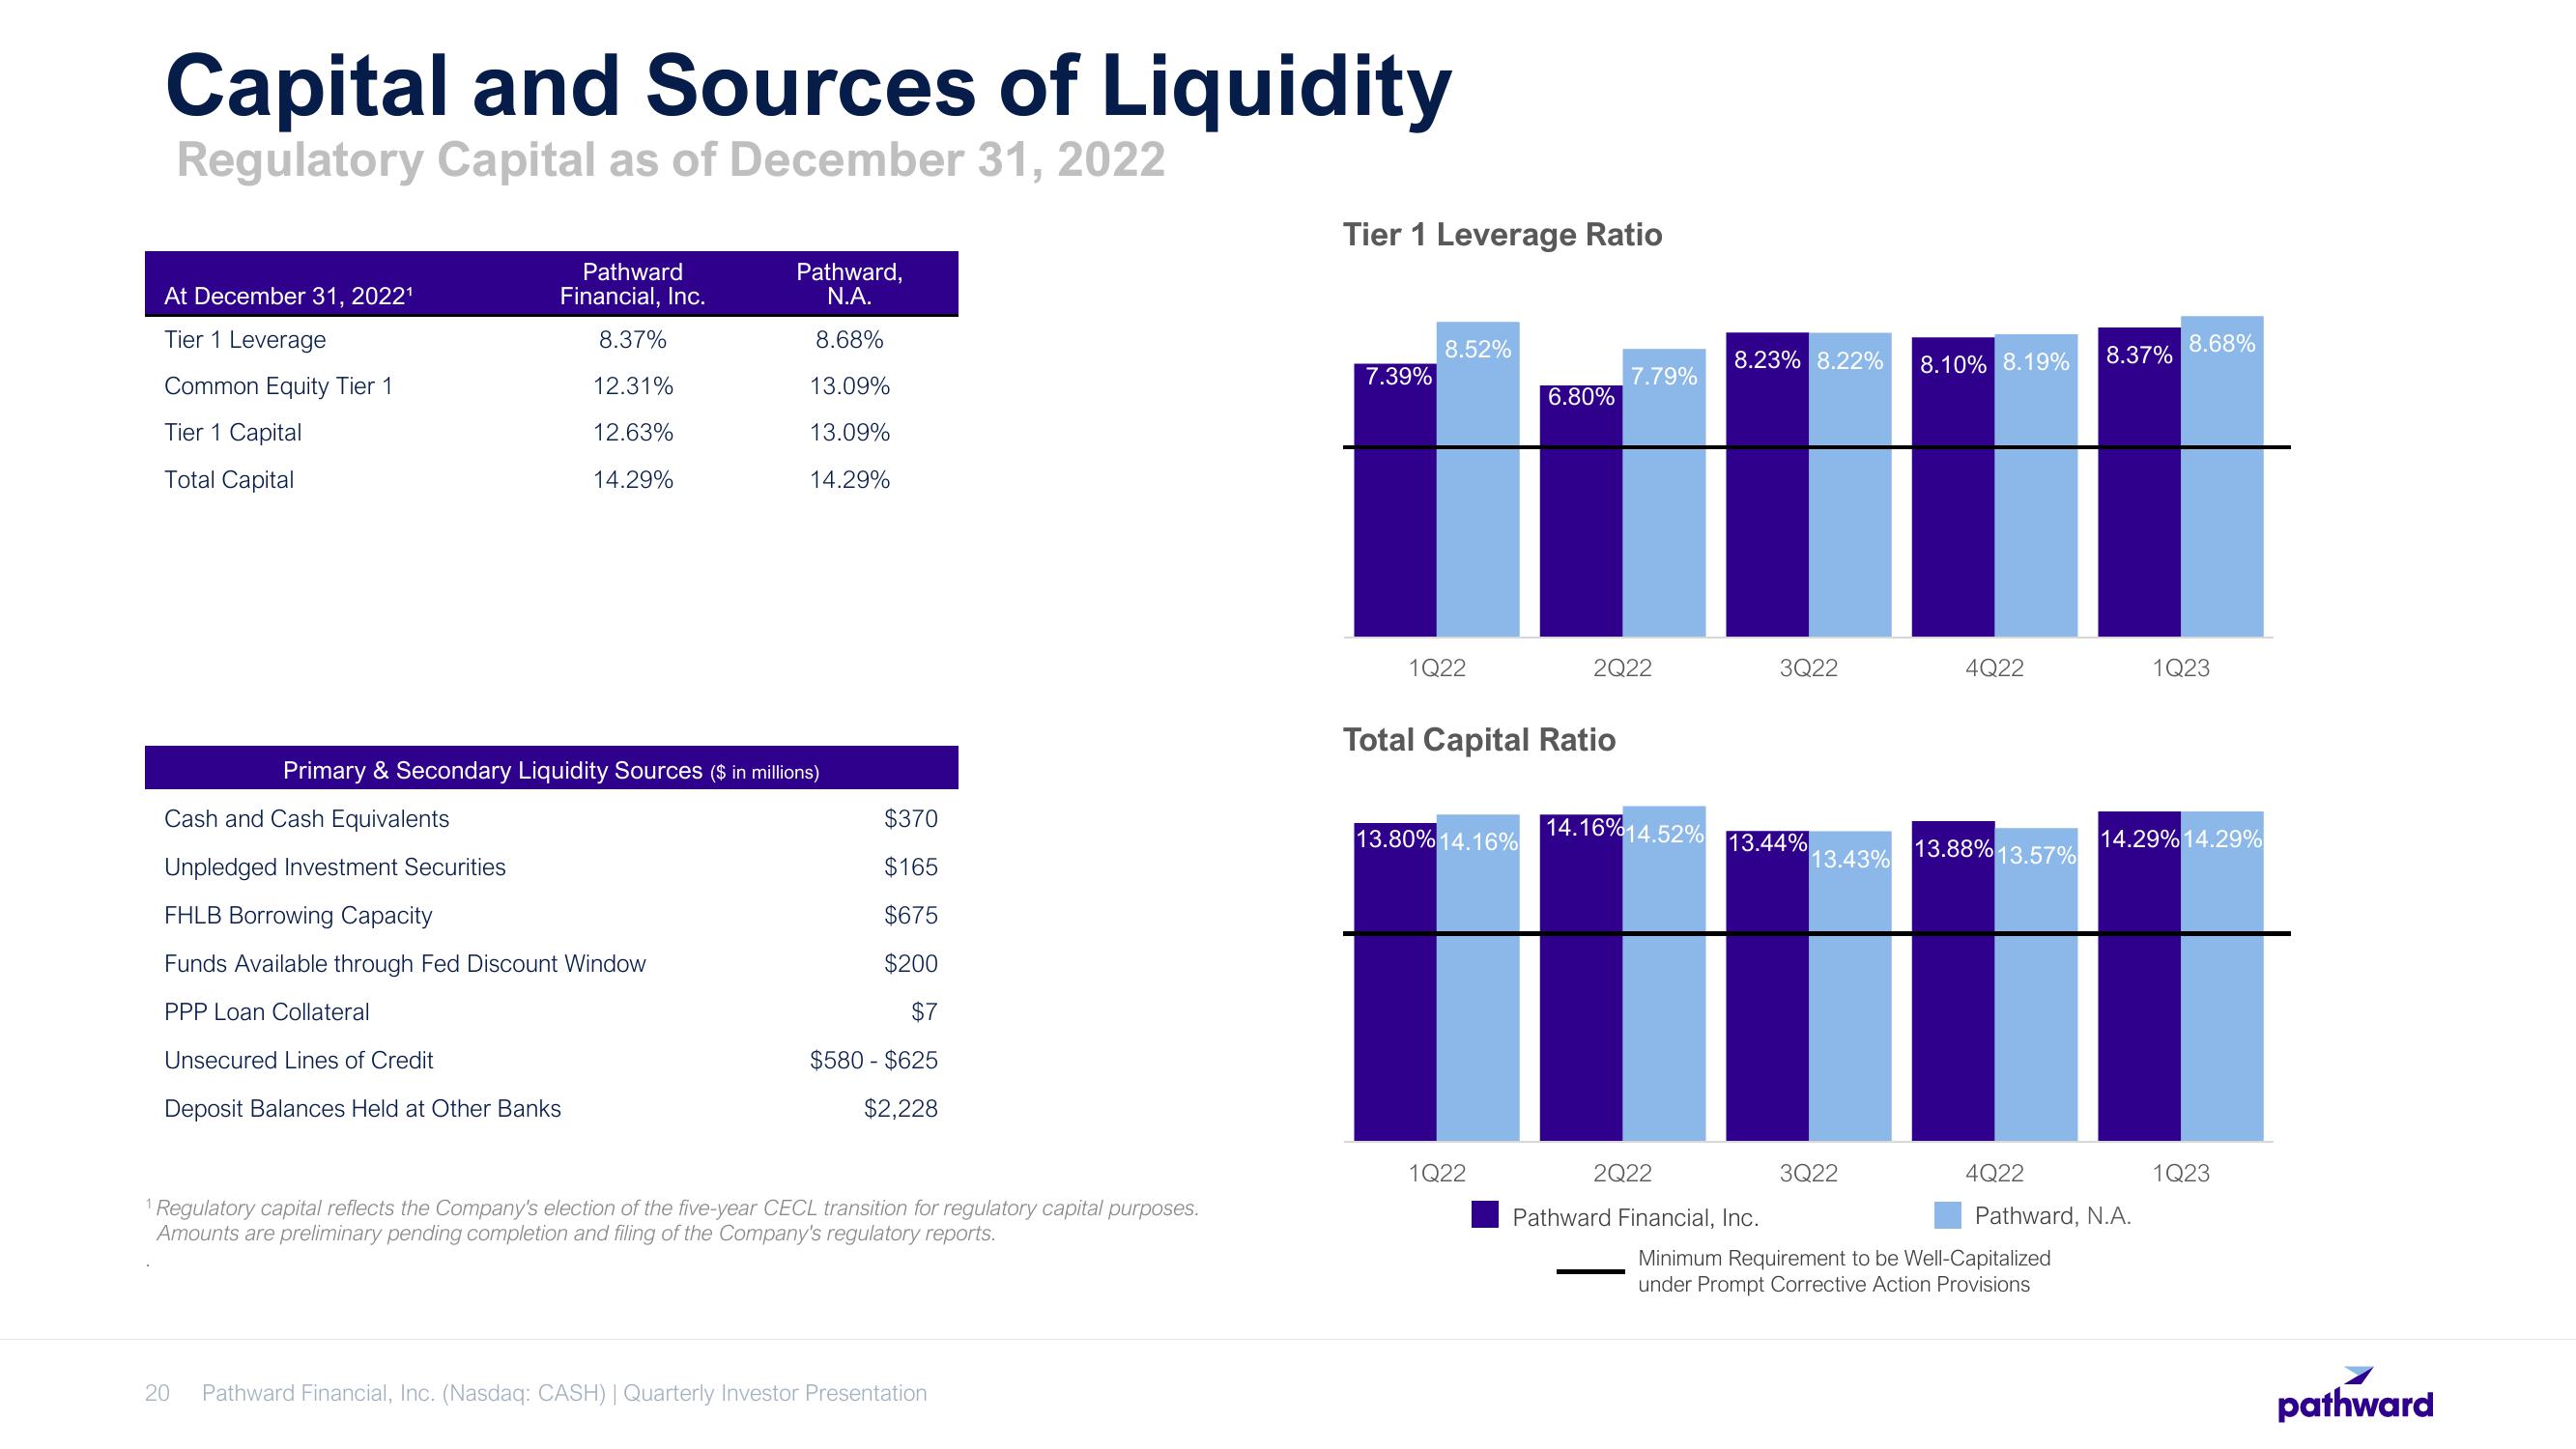
At December 31, 2022¹
Tier 1 Leverage
Common Equity Tier 1
Tier 1 Capital
Total Capital
Pathward
Financial, Inc.
8.37%
12.31%
12.63%
14.29%
Cash and Cash Equivalents
Unpledged Investment Securities
FHLB Borrowing Capacity
Funds Available through Fed Discount Window
PPP Loan Collateral
Unsecured Lines of Credit
Deposit Balances Held at Other Banks
20
Pathward,
N.A.
8.68%
13.09%
13.09%
14.29%
Primary & Secondary Liquidity Sources ($ in millions)
$370
$165
$675
$200
$7
$580 - $625
$2,228
¹ Regulatory capital reflects the Company's election of the five-year CECL transition for regulatory capital purposes.
Amounts are preliminary pending completion and filing of the Company's regulatory reports.
Pathward Financial, Inc. (Nasdaq: CASH) | Quarterly Investor Presentation
Tier 1 Leverage Ratio
7.39%
8.52%
1Q22
13.80% 14.16%
6.80%
Total Capital Ratio
1Q22
7.79%
2Q22
14.16%14.52%
2Q22
8.23% 8.22%
3Q22
13.44%
Pathward Financial, Inc.
13.43%
3Q22
8.10% 8.19%
4Q22
13.88% 13.57%
8.37%
Minimum Requirement to be Well-Capitalized
under Prompt Corrective Action Provisions
4Q22
Pathward, N.A.
8.68%
1Q23
14.29% 14.29%
1Q23
pathwardView entire presentation