Olaplex Results Presentation Deck
SECOND QUARTER 2023 HIGHLIGHTS
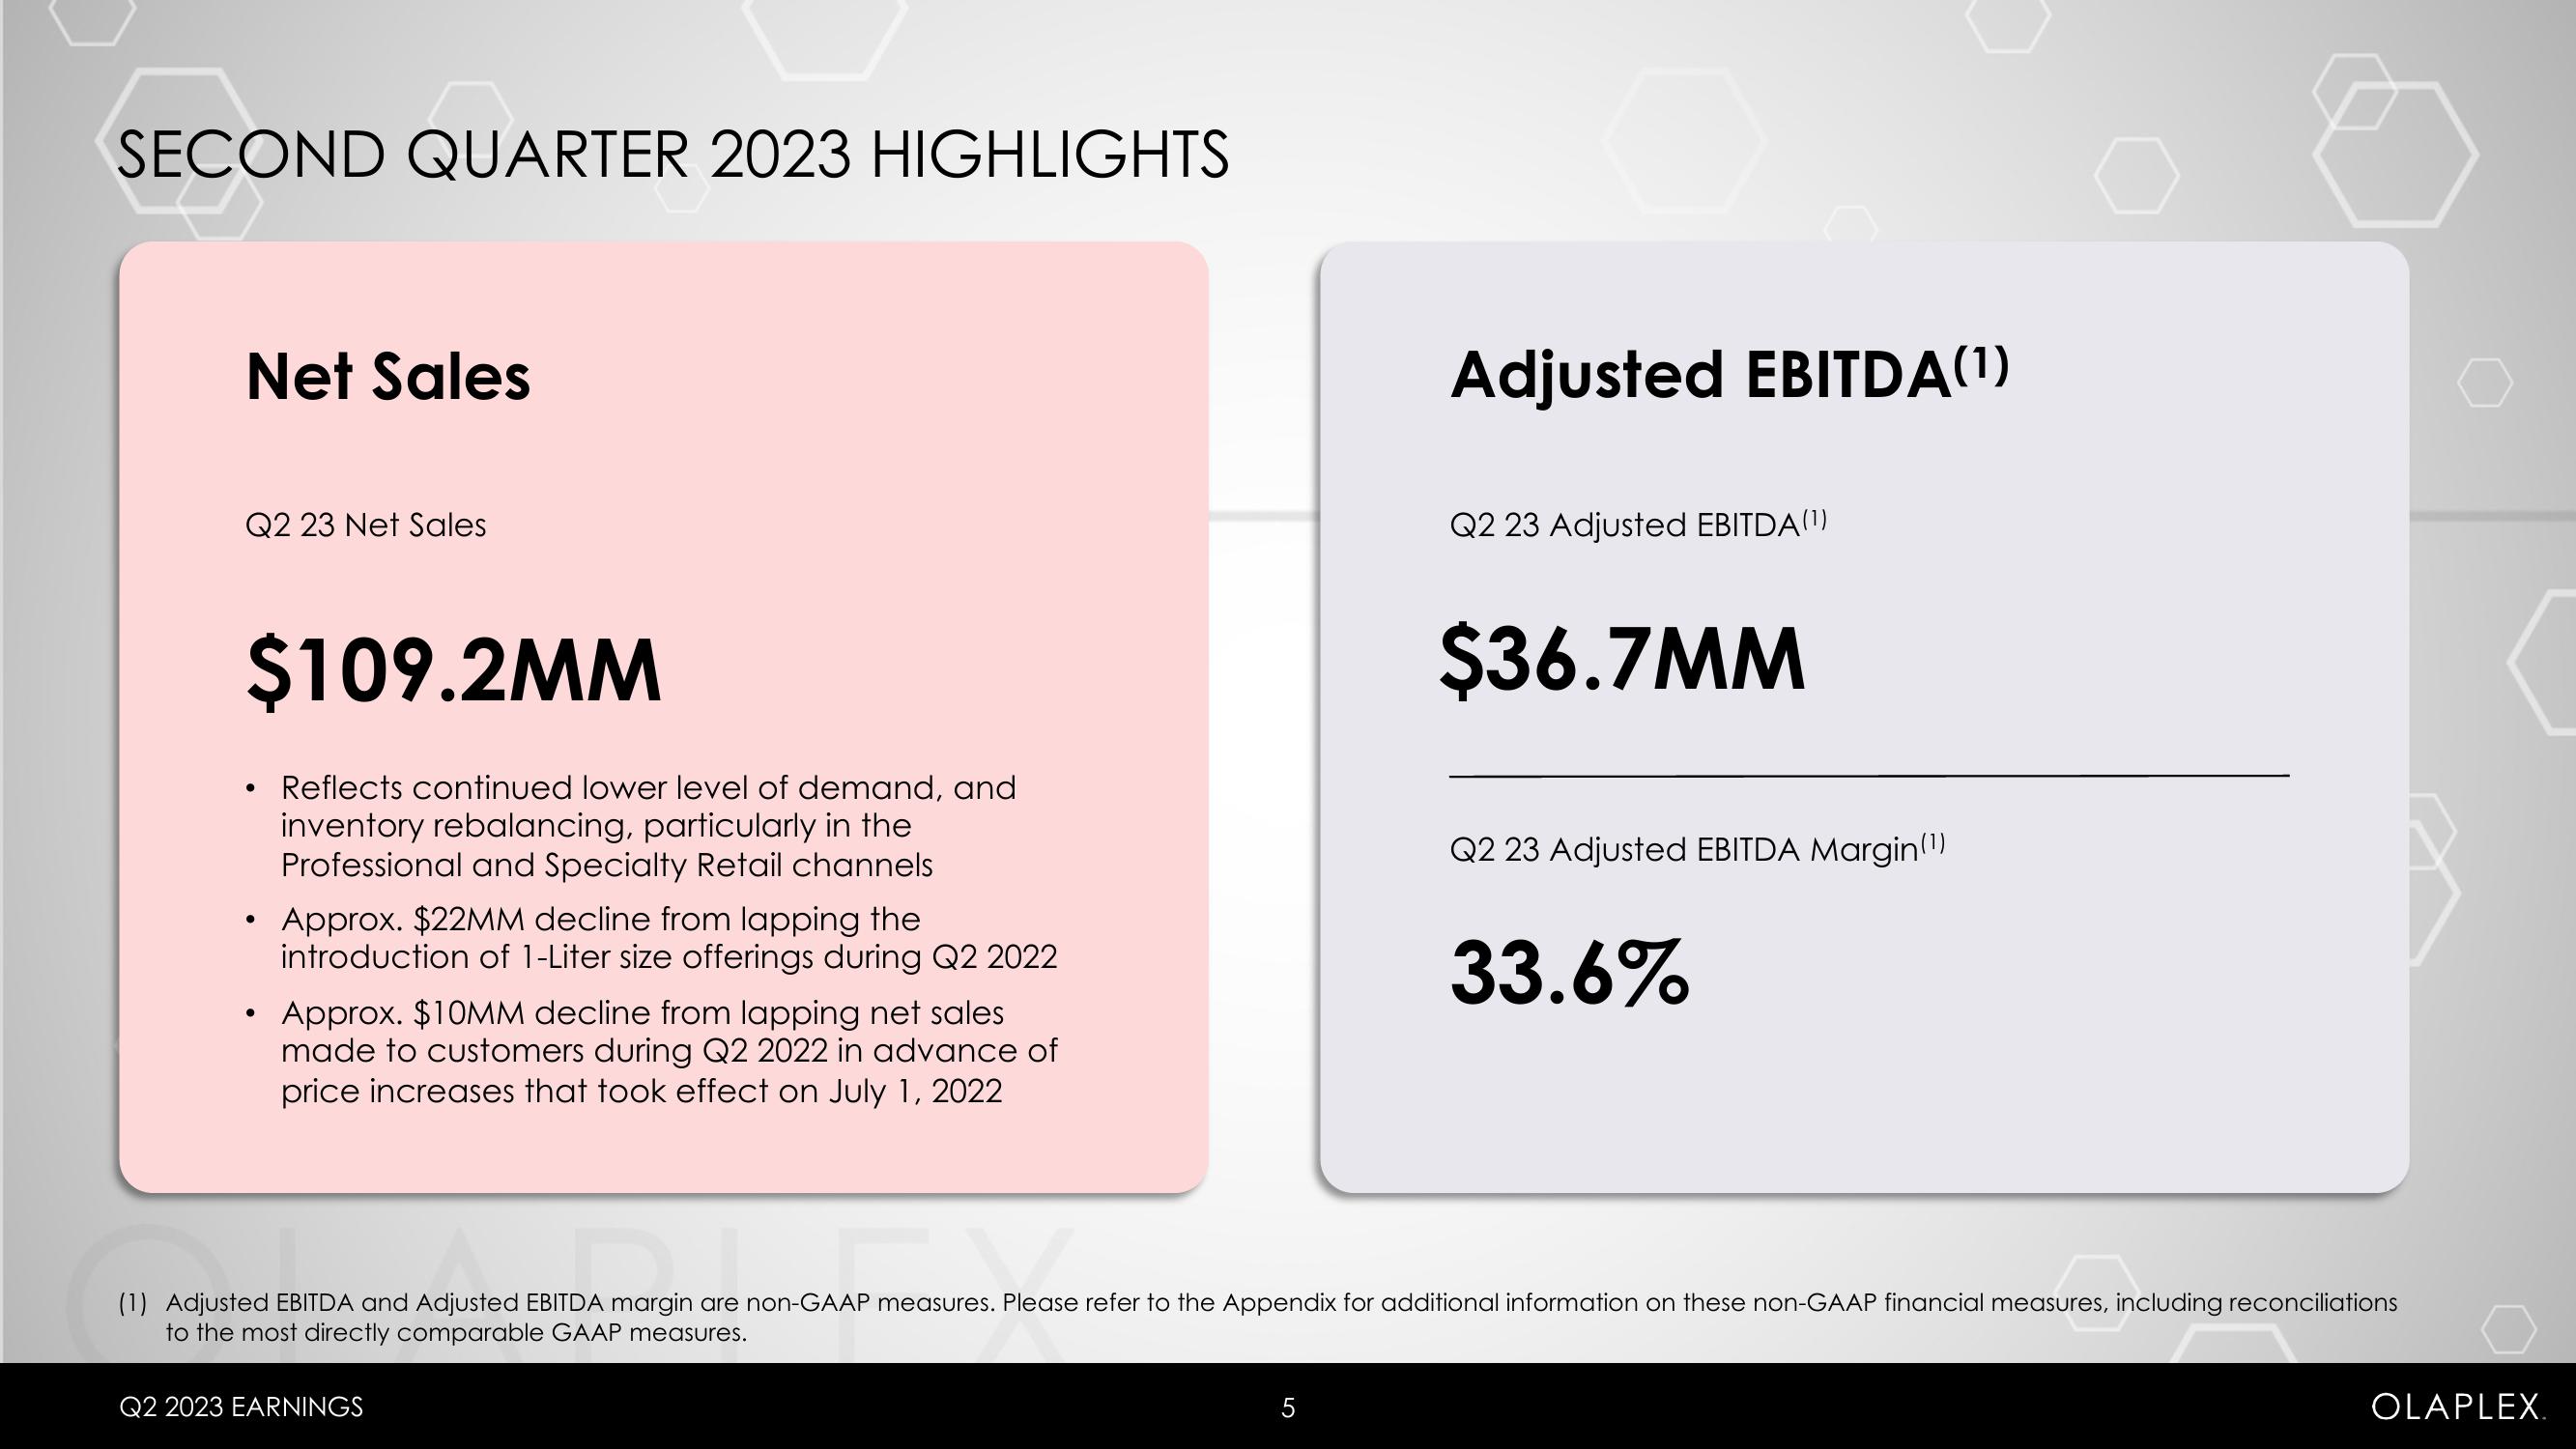
Net Sales
Q2 23 Net Sales
$109.2MM
• Reflects continued lower level of demand, and
inventory rebalancing, particularly in the
Professional and Specialty Retail channels
●
Approx. $22MM decline from lapping the
introduction of 1-Liter size offerings during Q2 2022
• Approx. $10MM decline from lapping net sales
made to customers during Q2 2022 in advance of
price increases that took effect on July 1, 2022
Adjusted EBITDA(¹)
Q2 2023 EARNINGS
Q2 23 Adjusted EBITDA (¹)
$36.7MM
Q2 23 Adjusted EBITDA Margin(¹)
33.6%
(1) Adjusted EBITDA and Adjusted EBITDA margin are non-GAAP measures. Please refer to the Appendix for additional information on these non-GAAP financial measures, including reconciliations
to the most directly comparable GAAP measures.
TDA margin of
OLAPLEX.View entire presentation