Corecentric Investor Presentation Deck
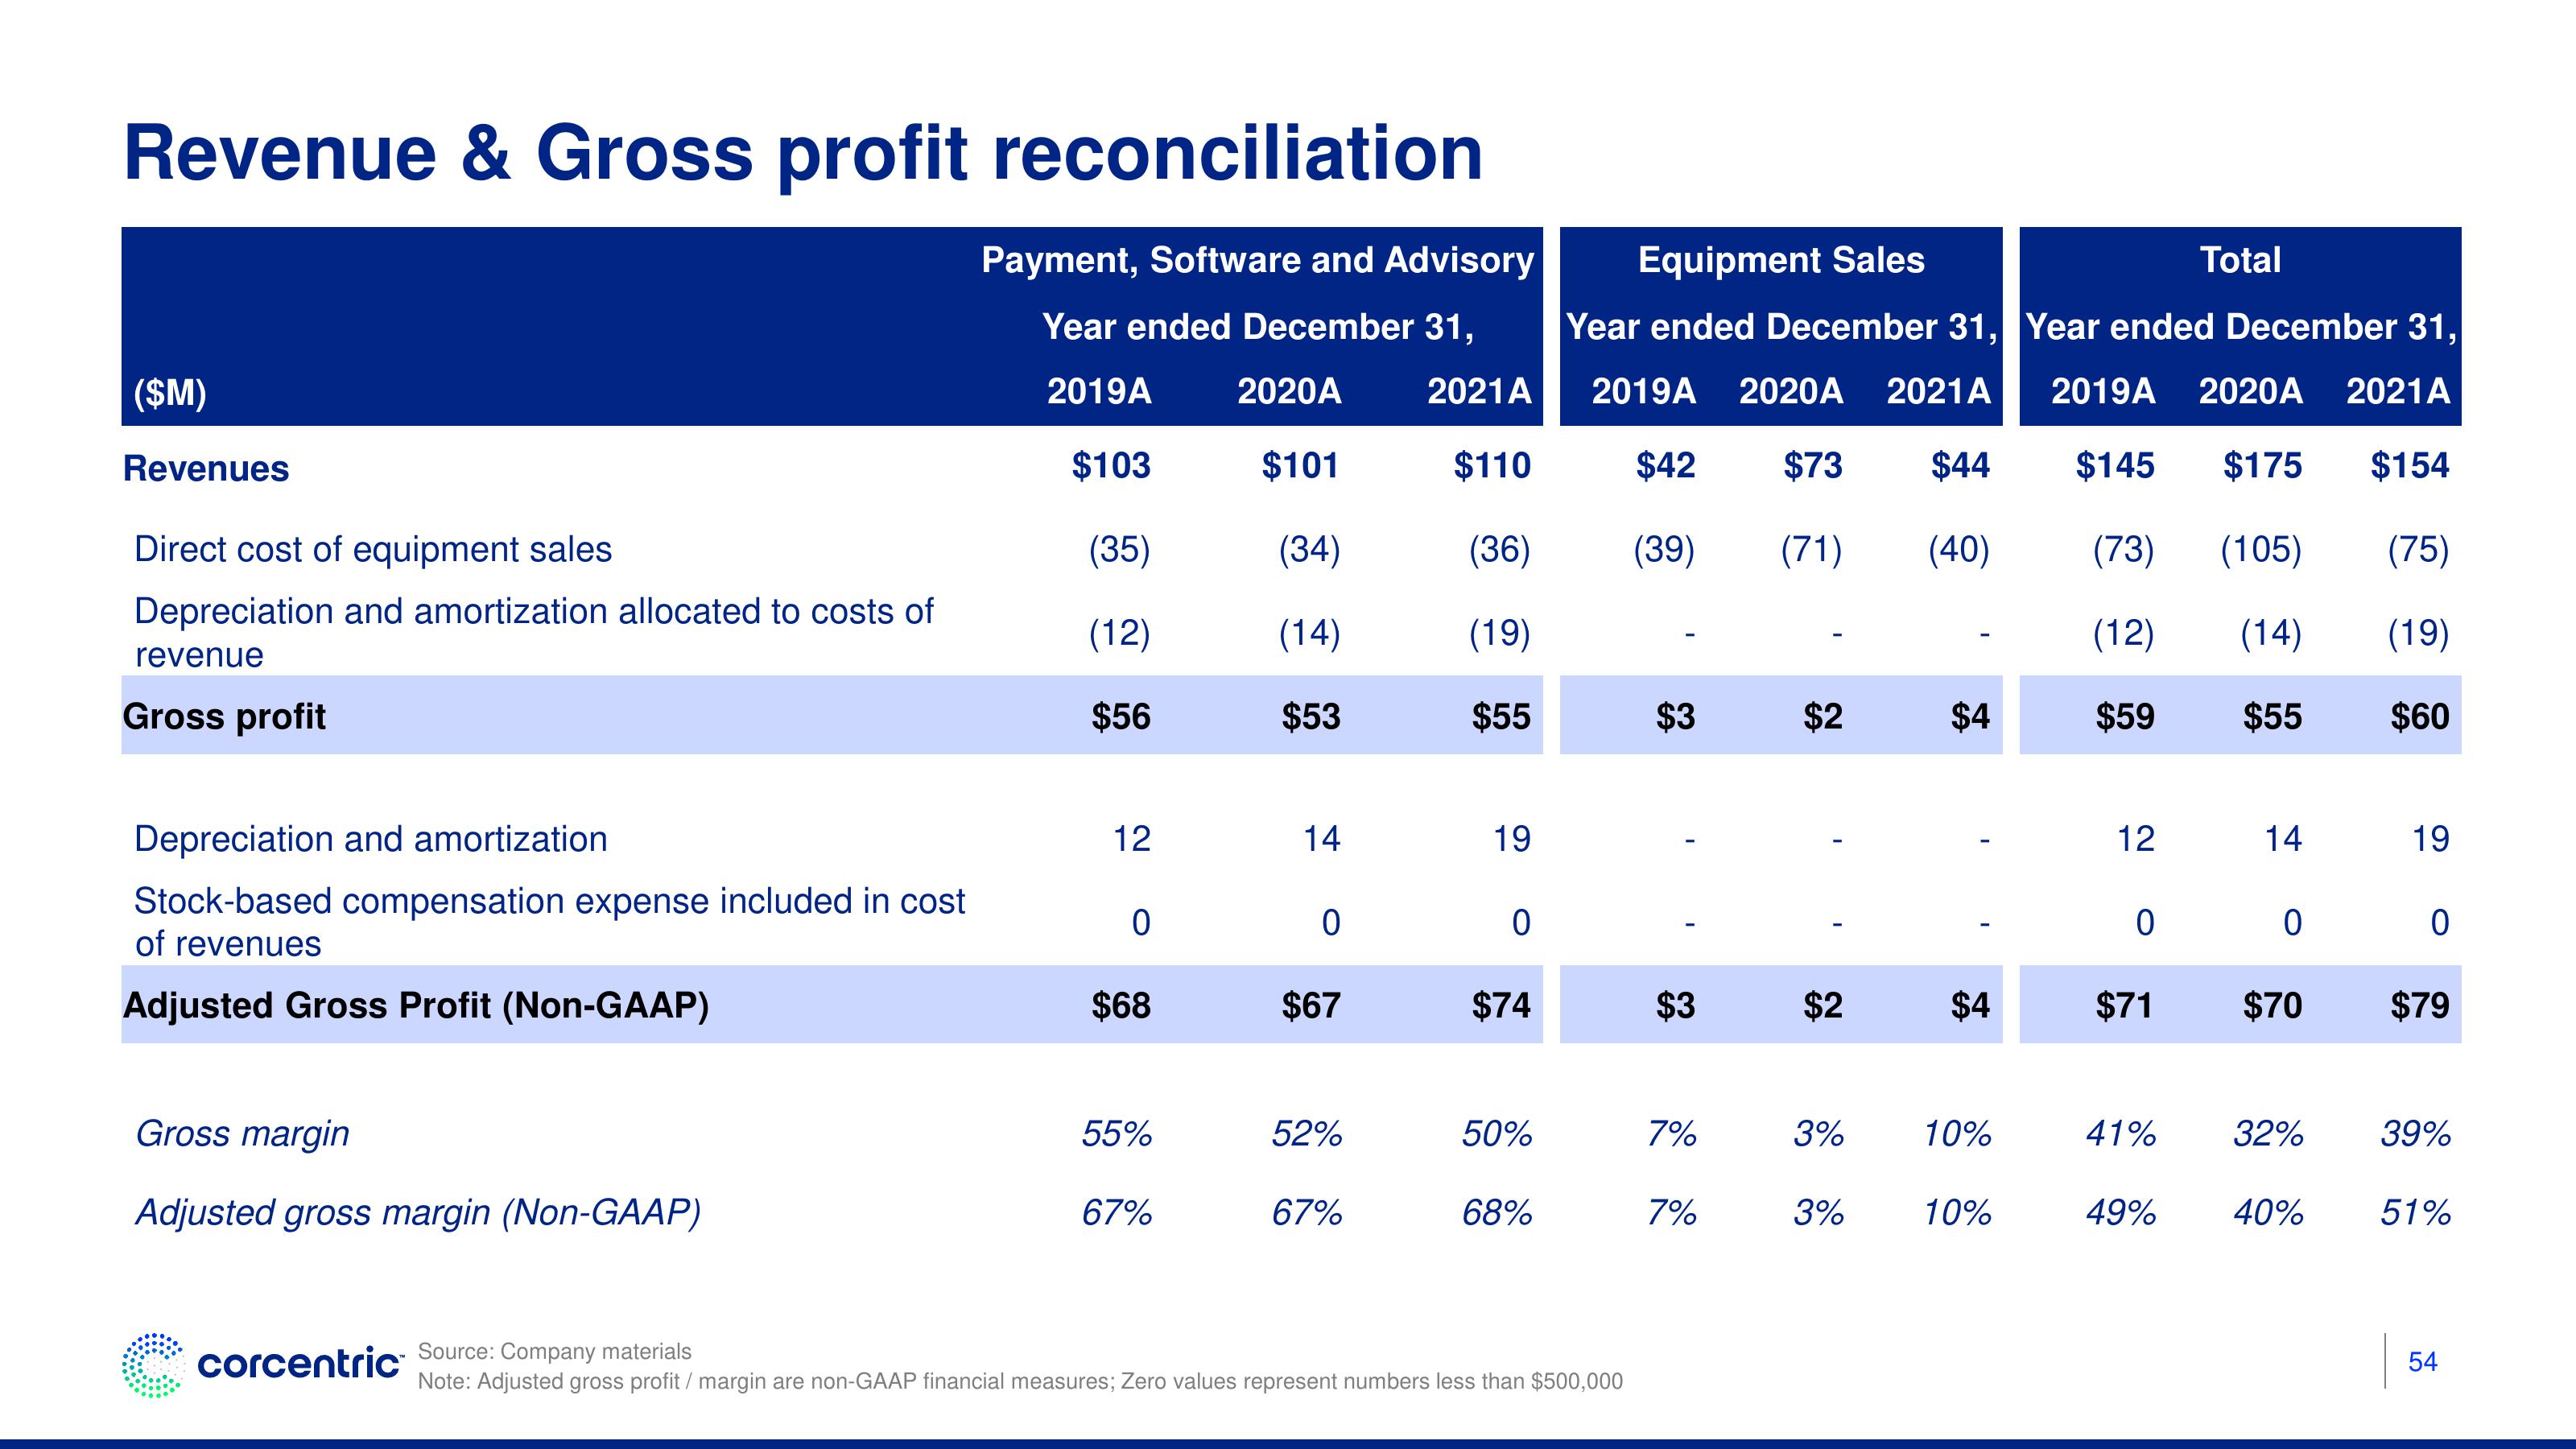
Revenue & Gross profit reconciliation
Payment, Software and Advisory
Year ended December 31,
2020A 2021A
2019A
$103
$101
$110
(35)
(34)
(36)
(12)
(14)
(19)
$56
$53
$55
($M)
Revenues
Direct cost of equipment sales
Depreciation and amortization allocated to costs of
revenue
Gross profit
Depreciation and amortization
Stock-based compensation expense included in cost
of revenues
Adjusted Gross Profit (Non-GAAP)
Gross margin
Adjusted gross margin (Non-GAAP)
corcentric
12
0
$68
55%
67%
14
0
$67
52%
67%
19
0
$74
50%
68%
Equipment Sales
Year ended December 31,
2019A 2020A 2021A
$44
$42 $73
(39) (71) (40)
Source: Company materials
Note: Adjusted gross profit/ margin are non-GAAP financial measures; Zero values represent numbers less than $500,000
$3
$3
7%
7%
$2
$2
3%
3%
$4
$4
10%
10%
Year ended December 31,
2019A 2020A 2021A
$145 $175 $154
(73) (105)
(75)
(12) (14)
(19)
$59
$55
$60
12
0
$71
Total
41%
14
0
$70
32%
49% 40%
19
0
$79
39%
51%
54View entire presentation