OmniAb Investor Presentation Deck
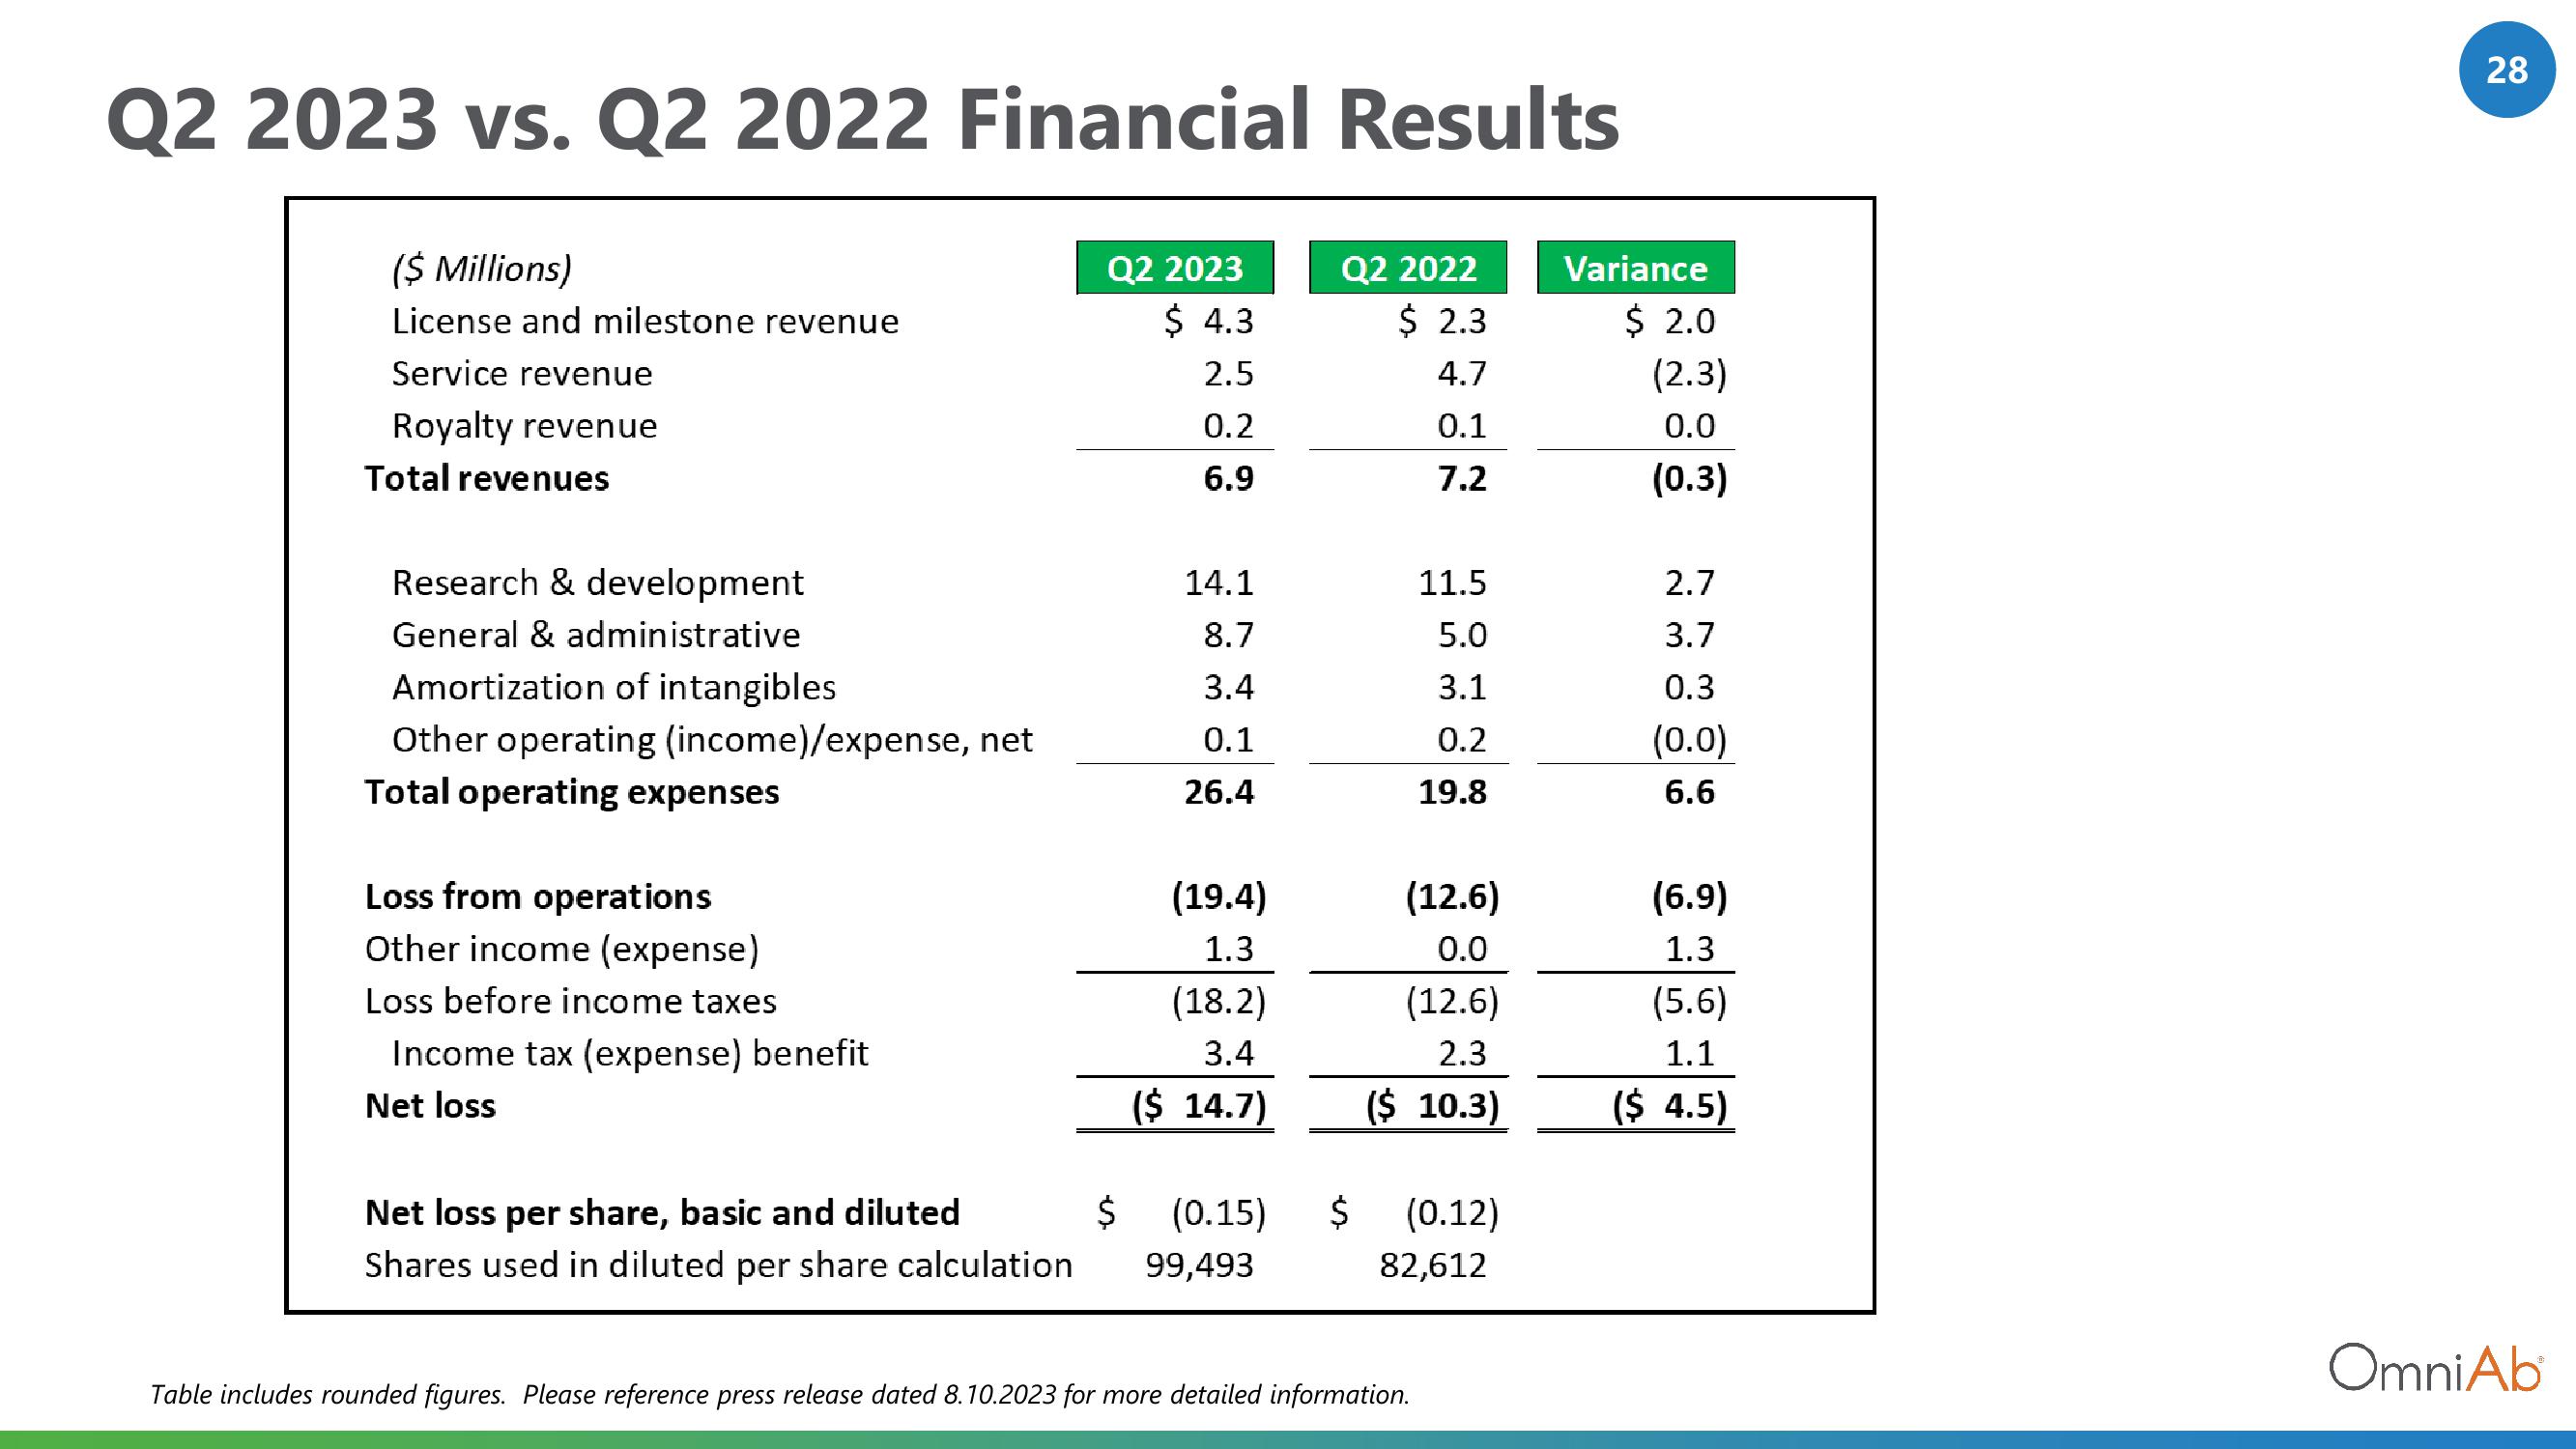
Q2 2023 vs. Q2 2022 Financial Results
($ Millions)
License and milestone revenue
Service revenue
Royalty revenue
Total revenues
Research & development
General & administrative
Amortization of intangibles
Other operating (income)/expense, net
Total operating expenses
Loss from operations
Other income (expense)
Loss before income taxes
Income tax (expense) benefit
Net loss
Net loss per share, basic and diluted
Shares used in diluted per share calculation
Q2 2023
$ 4.3
2.5
0.2
6.9
14.1
8.7
3.4
0.1
26.4
(19.4)
1.3
(18.2)
3.4
($ 14.7)
$ (0.15)
99,493
Q2 2022
$ 2.3
4.7
0.1
7.2
$
11.5
5.0
3.1
0.2
19.8
(12.6)
0.0
(12.6)
2.3
($ 10.3)
(0.12)
82,612
Table includes rounded figures. Please reference press release dated 8.10.2023 for more detailed information.
Variance
$ 2.0
(2.3)
0.0
(0.3)
2.7
3.7
0.3
(0.0)
6.6
(6.9)
1.3
(5.6)
1.1
($ 4.5)
28
OmniAbView entire presentation