Comcast Results Presentation Deck
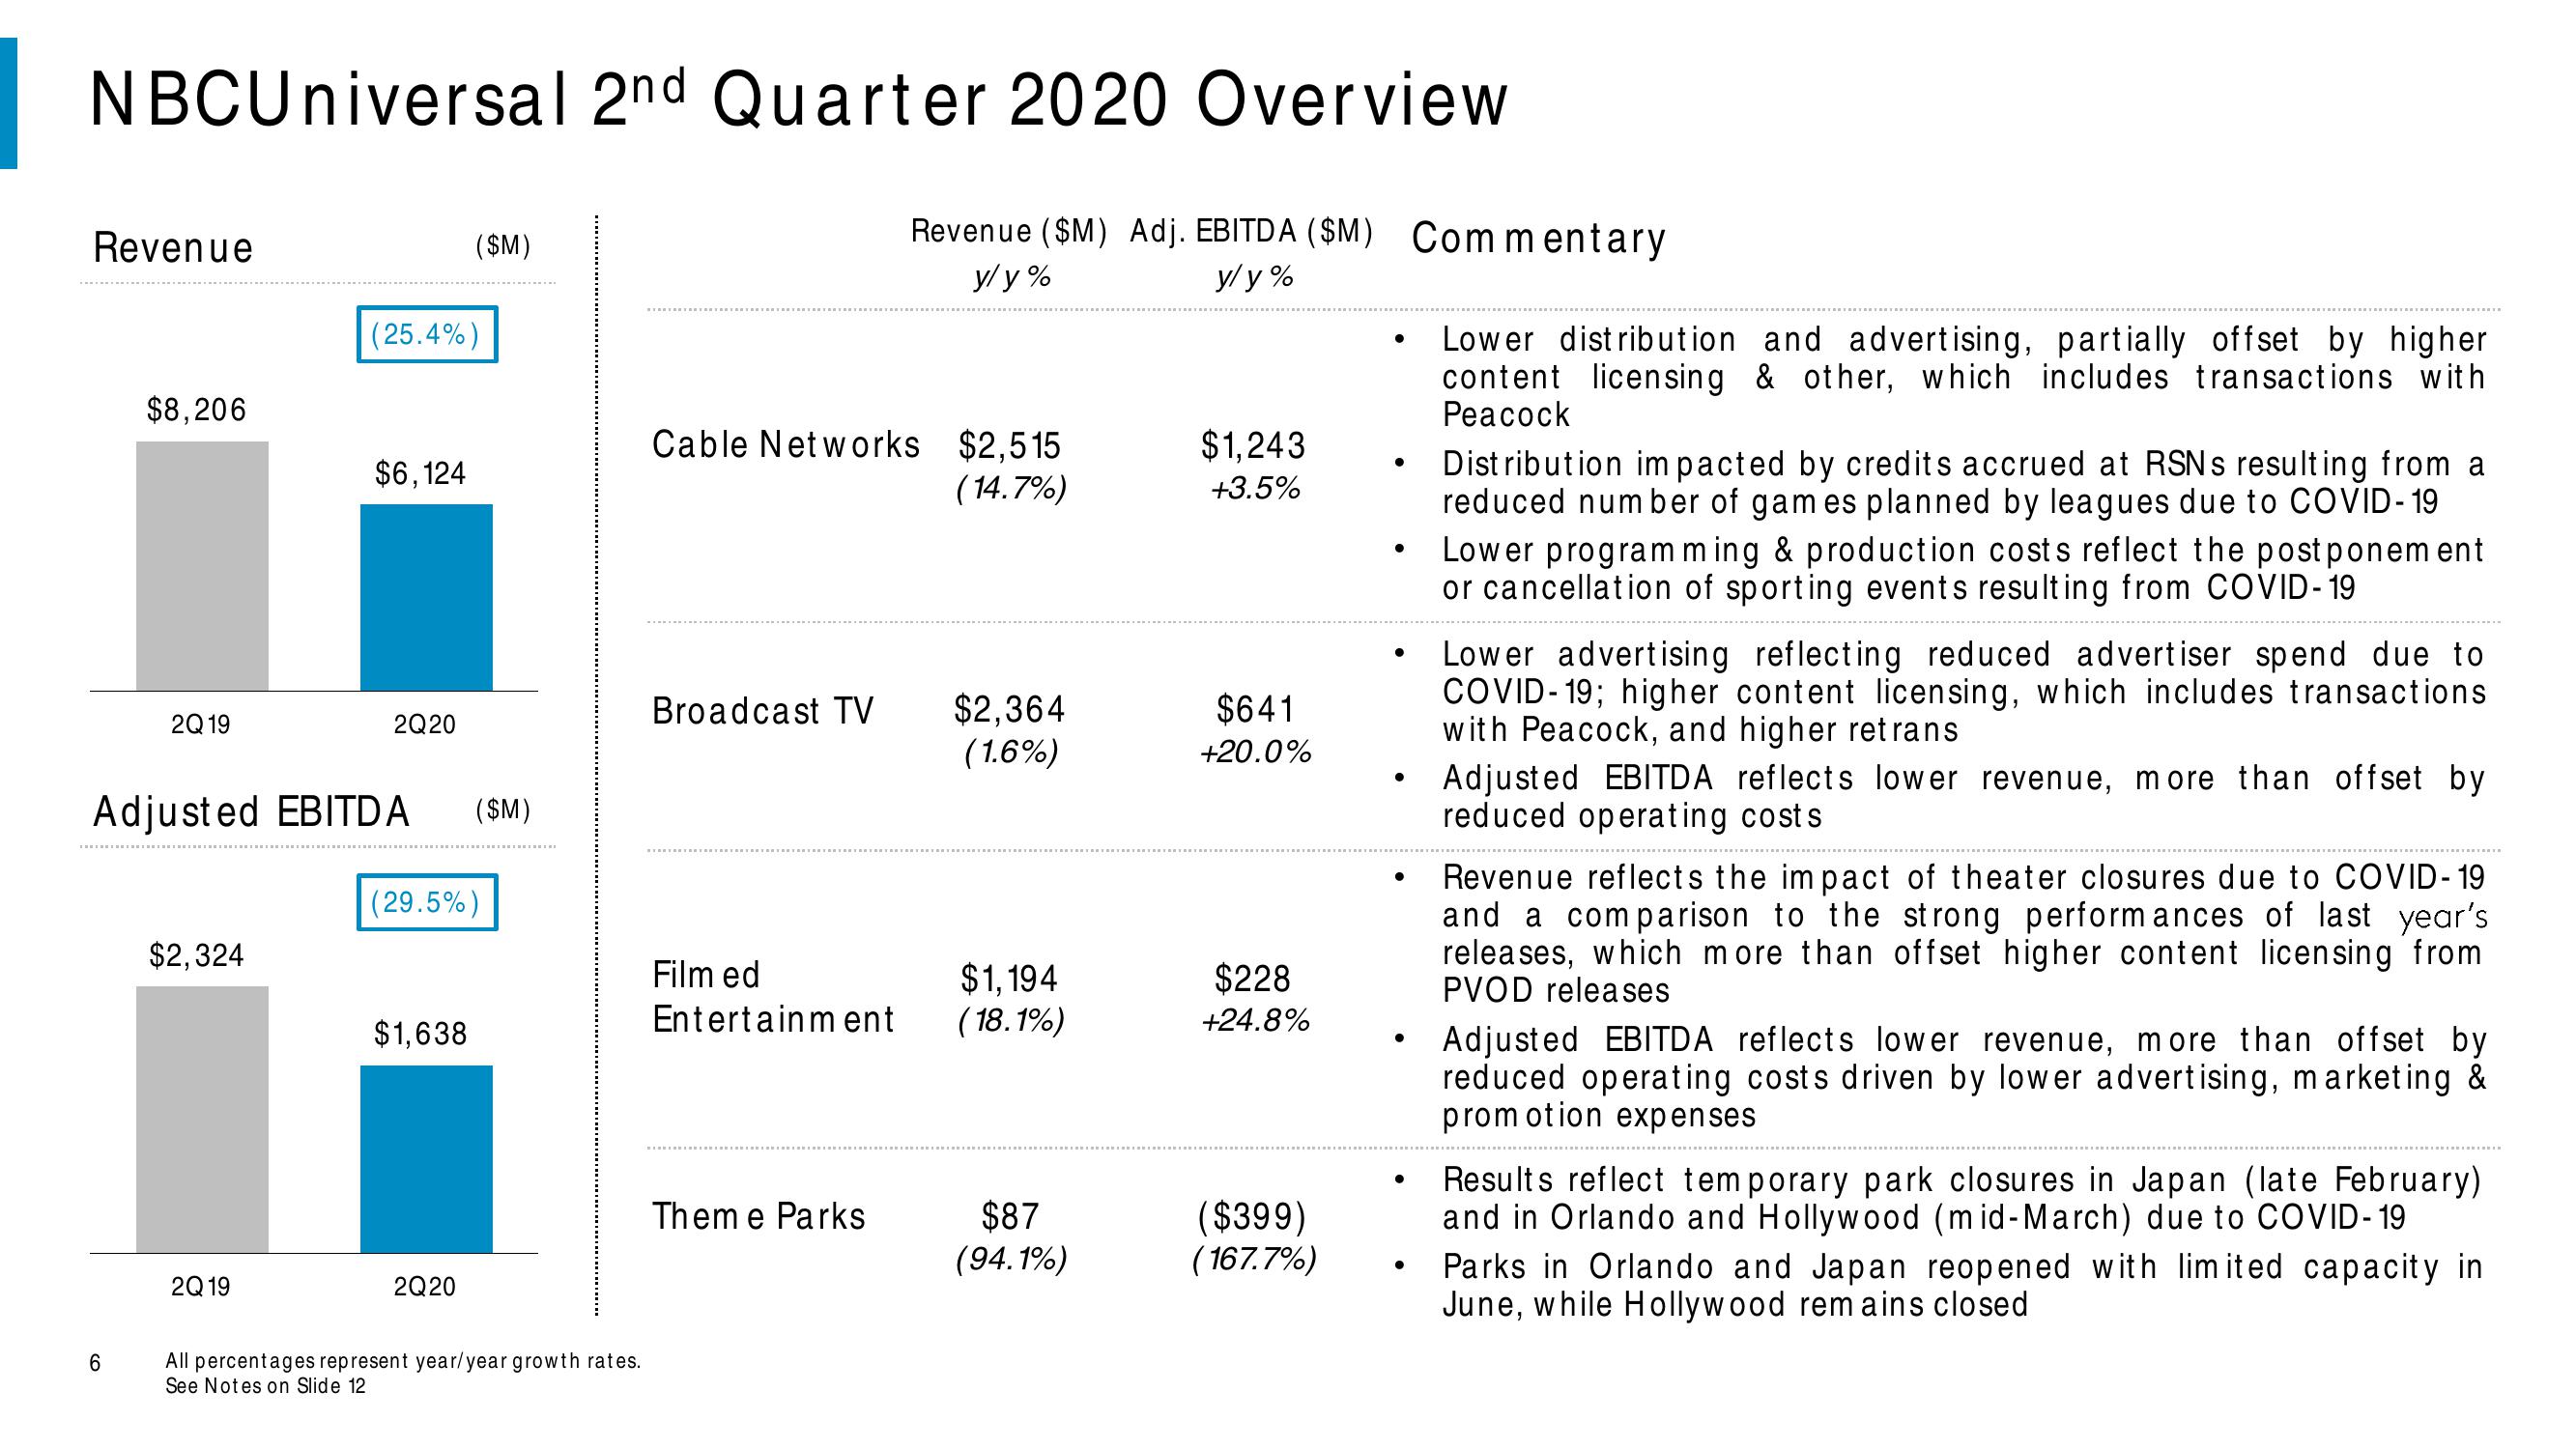
NBCUniversal 2nd Quarter 2020 Overview
Revenue
$8,206
6
2Q 19
$2,324
2Q19
(25.4%)
$6,124
Adjusted EBITDA ($M)
2Q20
($M)
(29.5%)
$1,638
2Q20
All percentages represent year/year growth rates.
See Notes on Slide 12
Cable Networks $2,515
(14.7%)
Revenue ($M) Adj. EBITDA ($M) Commentary
y/y%
y/y%
Broadcast TV $2,364
(1.6%)
Film ed
Entertainment
Theme Parks
$1,194
(18.1%)
$87
(94.1%)
$1,243
+3.5%
$641
+20.0%
$228
+24.8%
($399)
(167.7%)
●
●
●
●
Lower distribution and advertising, partially offset by higher
content licensing & other, which includes transactions with
Peacock
Distribution impacted by credits accrued at RSNs resulting from a
reduced number of games planned by leagues due to COVID-19
Lower programming & production costs reflect the postponement
or cancellation of sporting events resulting from COVID-19
Lower advertising reflecting reduced advertiser spend due to
COVID-19; higher content licensing, which includes transactions
with Peacock, and higher retrans
Adjusted EBITDA reflects lower revenue, more than offset by
reduced operating costs
Revenue reflects the impact of theater closures due to COVID-19
and a comparison to the strong performances of last year's
releases, which more than offset higher content licensing from
PVOD releases
Adjusted EBITDA reflects lower revenue, more than offset by
reduced operating costs driven by lower advertising, marketing &
promotion expenses
Results reflect temporary park closures in Japan (late February)
and in Orlando and Hollywood (mid-March) due to COVID-19
Parks in Orlando and Japan reopened with limited capacity in
June, while Hollywood remains closedView entire presentation