Olaplex IPO Presentation Deck
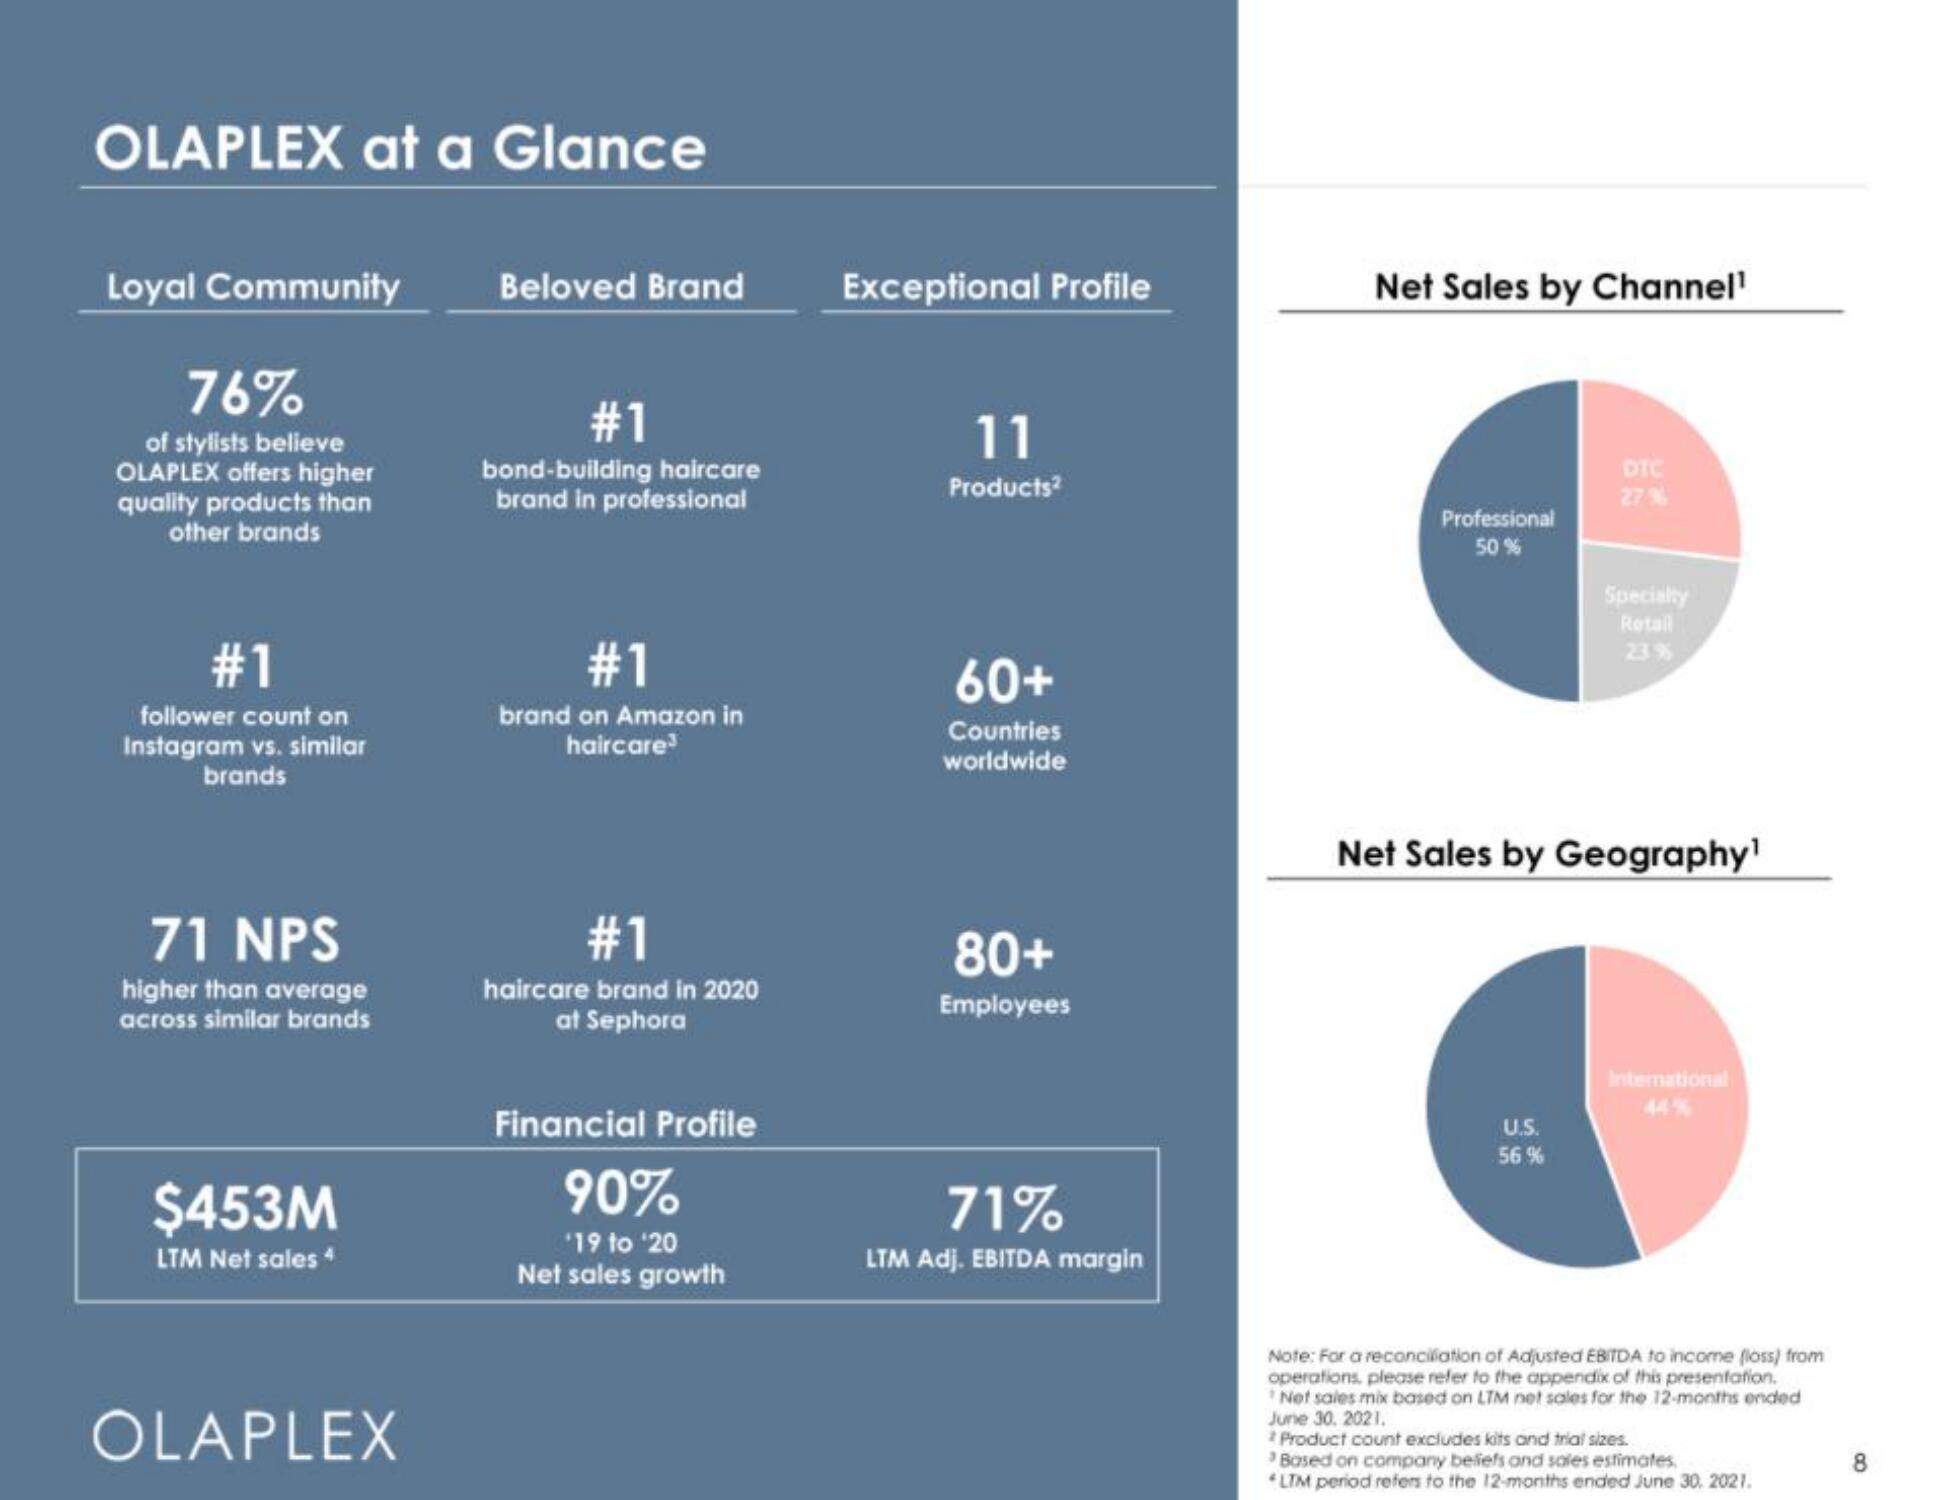
OLAPLEX at a Glance
Loyal Community
76%
of stylists believe
OLAPLEX offers higher
quality products than
other brands
#1
follower count on
Instagram vs. similar
brands
71 NPS
higher than average
across similar brands
$453M
LTM Net sales 4
OLAPLEX
Beloved Brand
#1
bond-building haircare
brand in professional
#1
brand on Amazon in
haircare
#1
haircare brand in 2020
at Sephora
Financial Profile
90%
'19 to '20
Net sales growth
Exceptional Profile
11
Products²
60+
Countries
worldwide
80+
Employees
71%
LTM Adj. EBITDA margin
Net Sales by Channel¹
Professional
50%
DIC
27%
U.S.
56%
Specialty
Retail
23 %
Net Sales by Geography¹
International
Note: For a reconciliation of Adjusted EBITDA to income (loss) from
operations, please refer to the appendix of this presentation.
Net sales mix based on LTM net sales for the 12-months ended
June 30, 2021.
Product count excludes kits and trial sizes.
Based on company beliefs and sales estimates.
LTM period refers to the 12-months ended June 30, 2021.
8View entire presentation