Overstock Results Presentation Deck
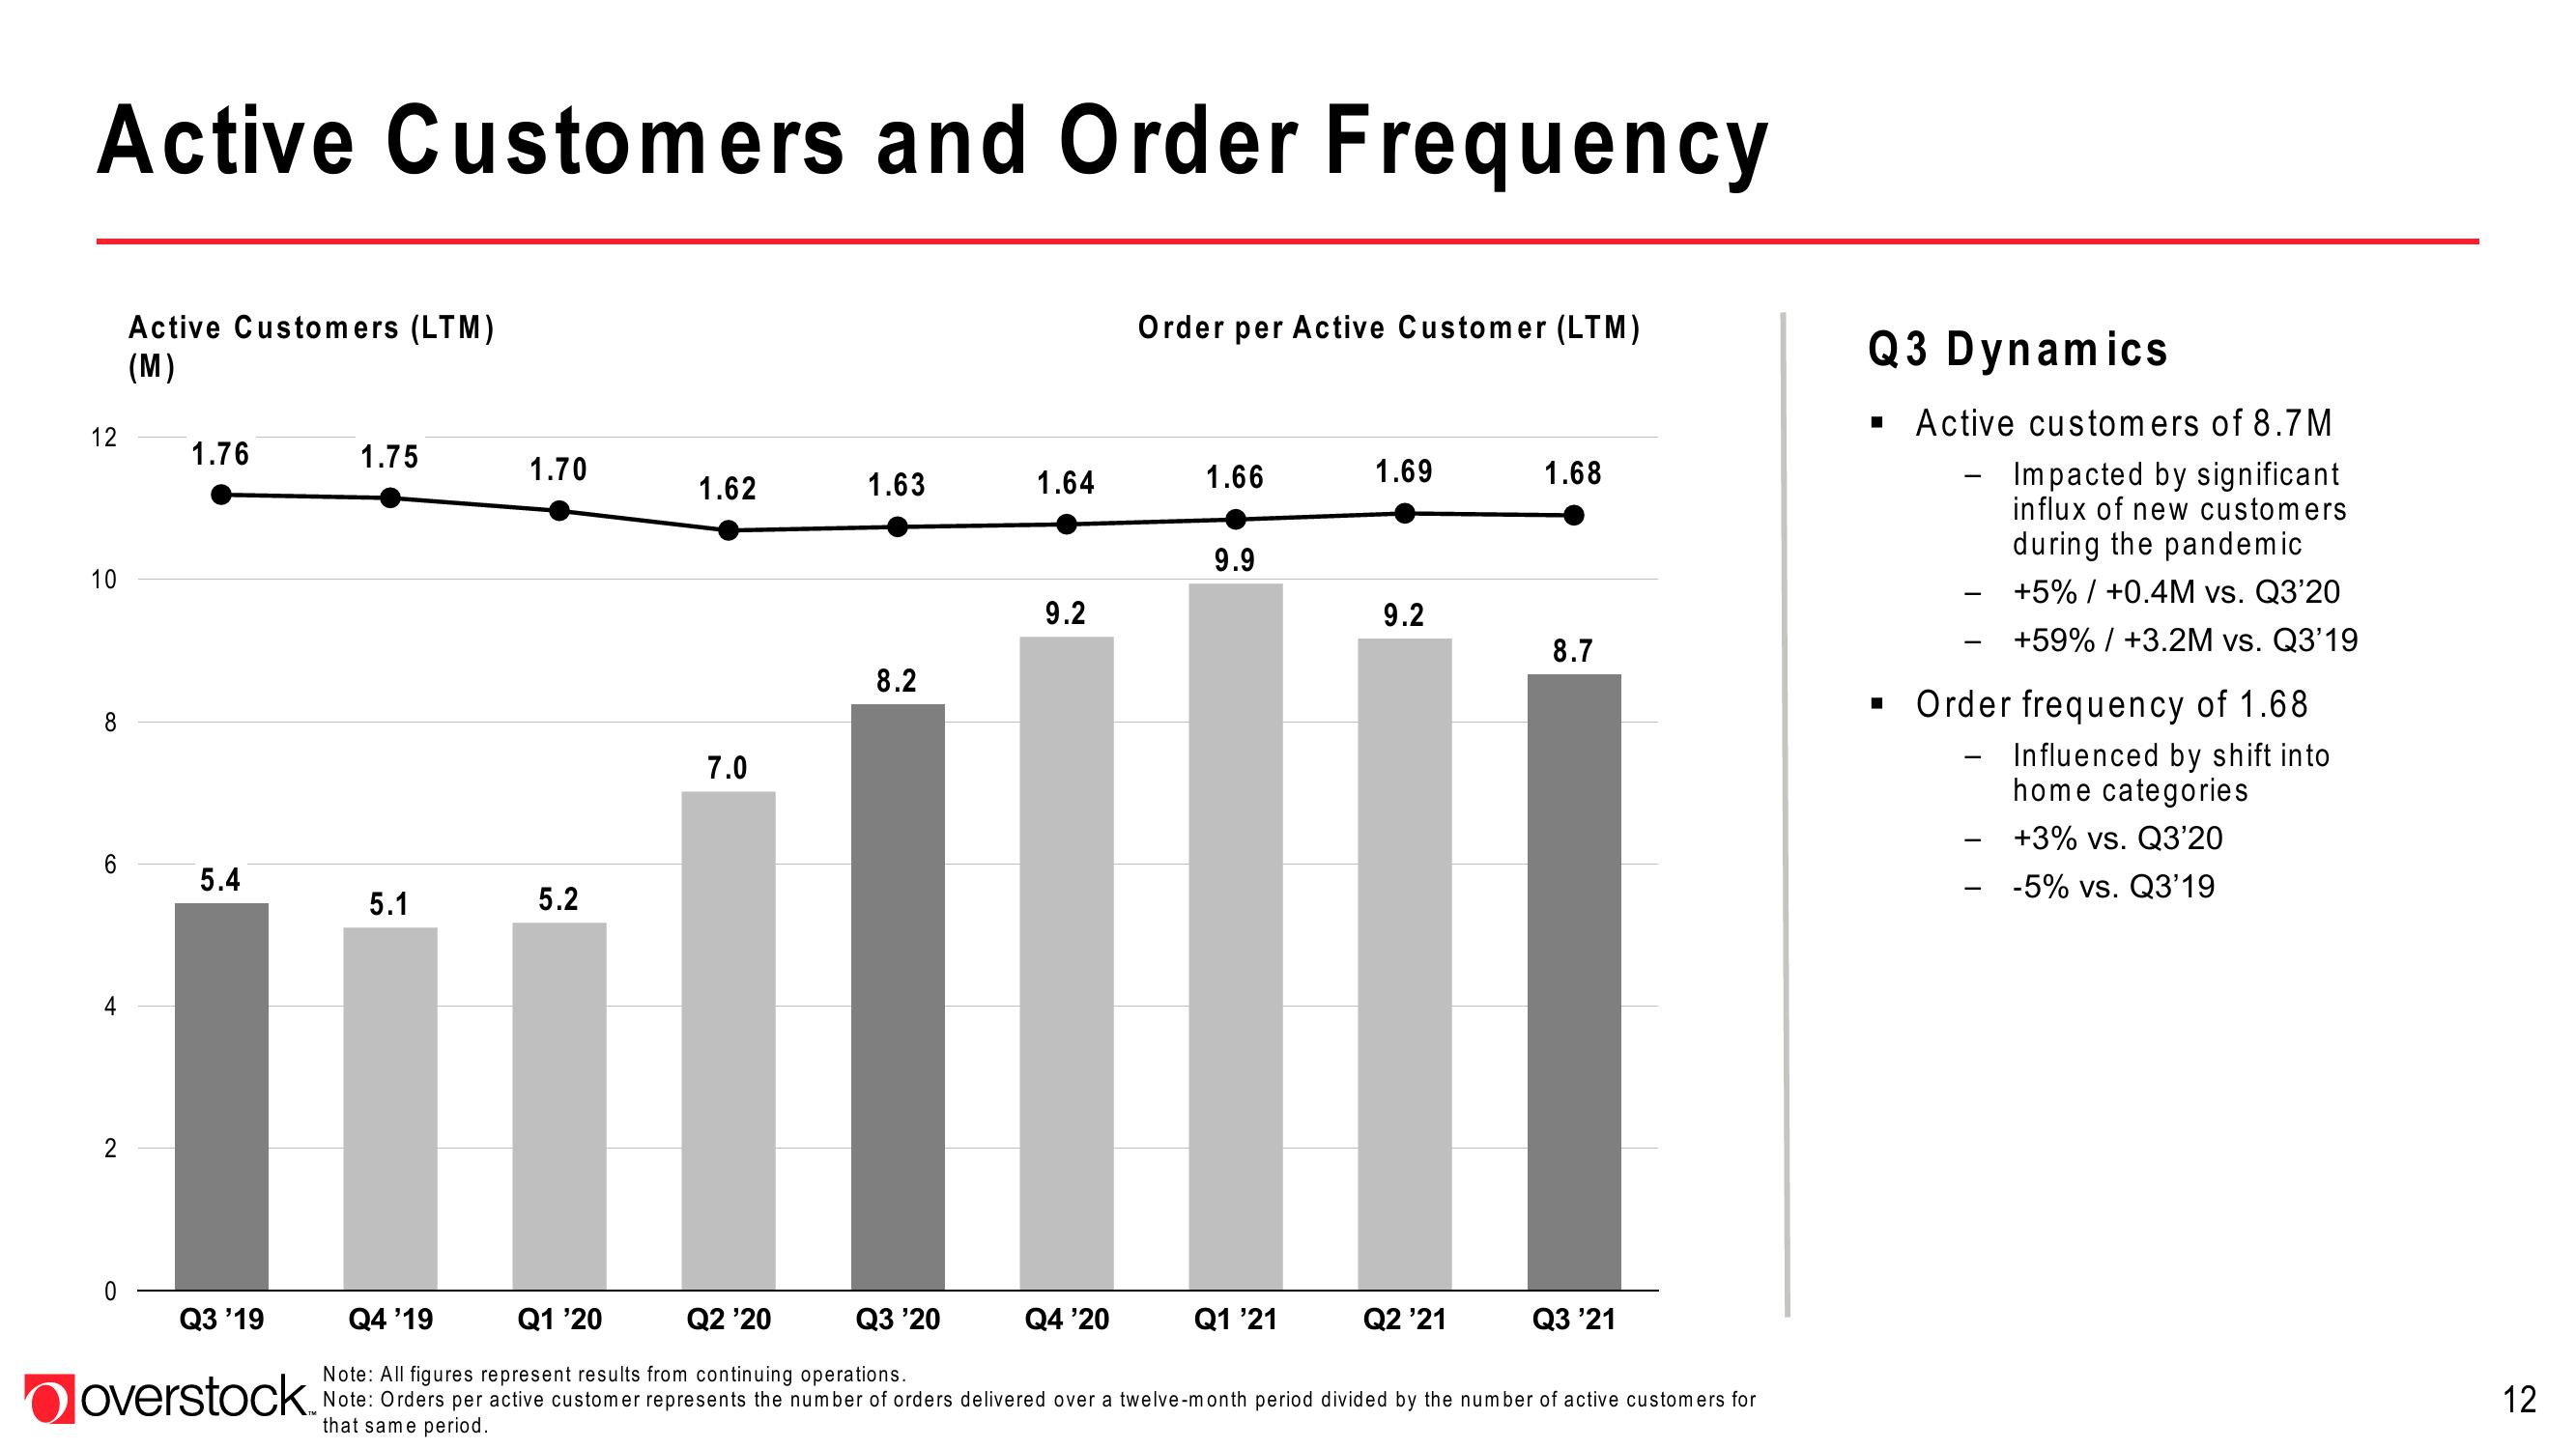
Active Customers and Order Frequency
12
10
8
6
2
0
Active Customers (LTM)
(M)
1.76
5.4
Q3 '19
overstock.
1.75
5.1
1.70
5.2
1.62
7.0
1.63
8.2
1.64
9.2
Q4 '20
Order per Active Customer (LTM)
1.66
9.9
Q1 '21
1.69
9.2
Q4 '19
Q1 '20
Q2 '20
Q3 '20
Note: All figures represent results from continuing operations.
Note: Orders per active customer represents the number of orders delivered over a twelve-month period divided by the number of active customers for
that same period.
Q2 '21
1.68
8.7
Q3 '21
Q3 Dynamics
■ Active customers of 8.7M
Impacted by significant
influx of new customers
during the pandemic
+5% / +0.4M vs. Q3'20
+59% / +3.2M vs. Q3'19
▪ Order frequency of 1.68
Influenced by shift into
home categories
+3% vs. Q3'20
-5% vs. Q3'19
12View entire presentation