IBM Results Presentation Deck
Non-GAAP supplemental materials
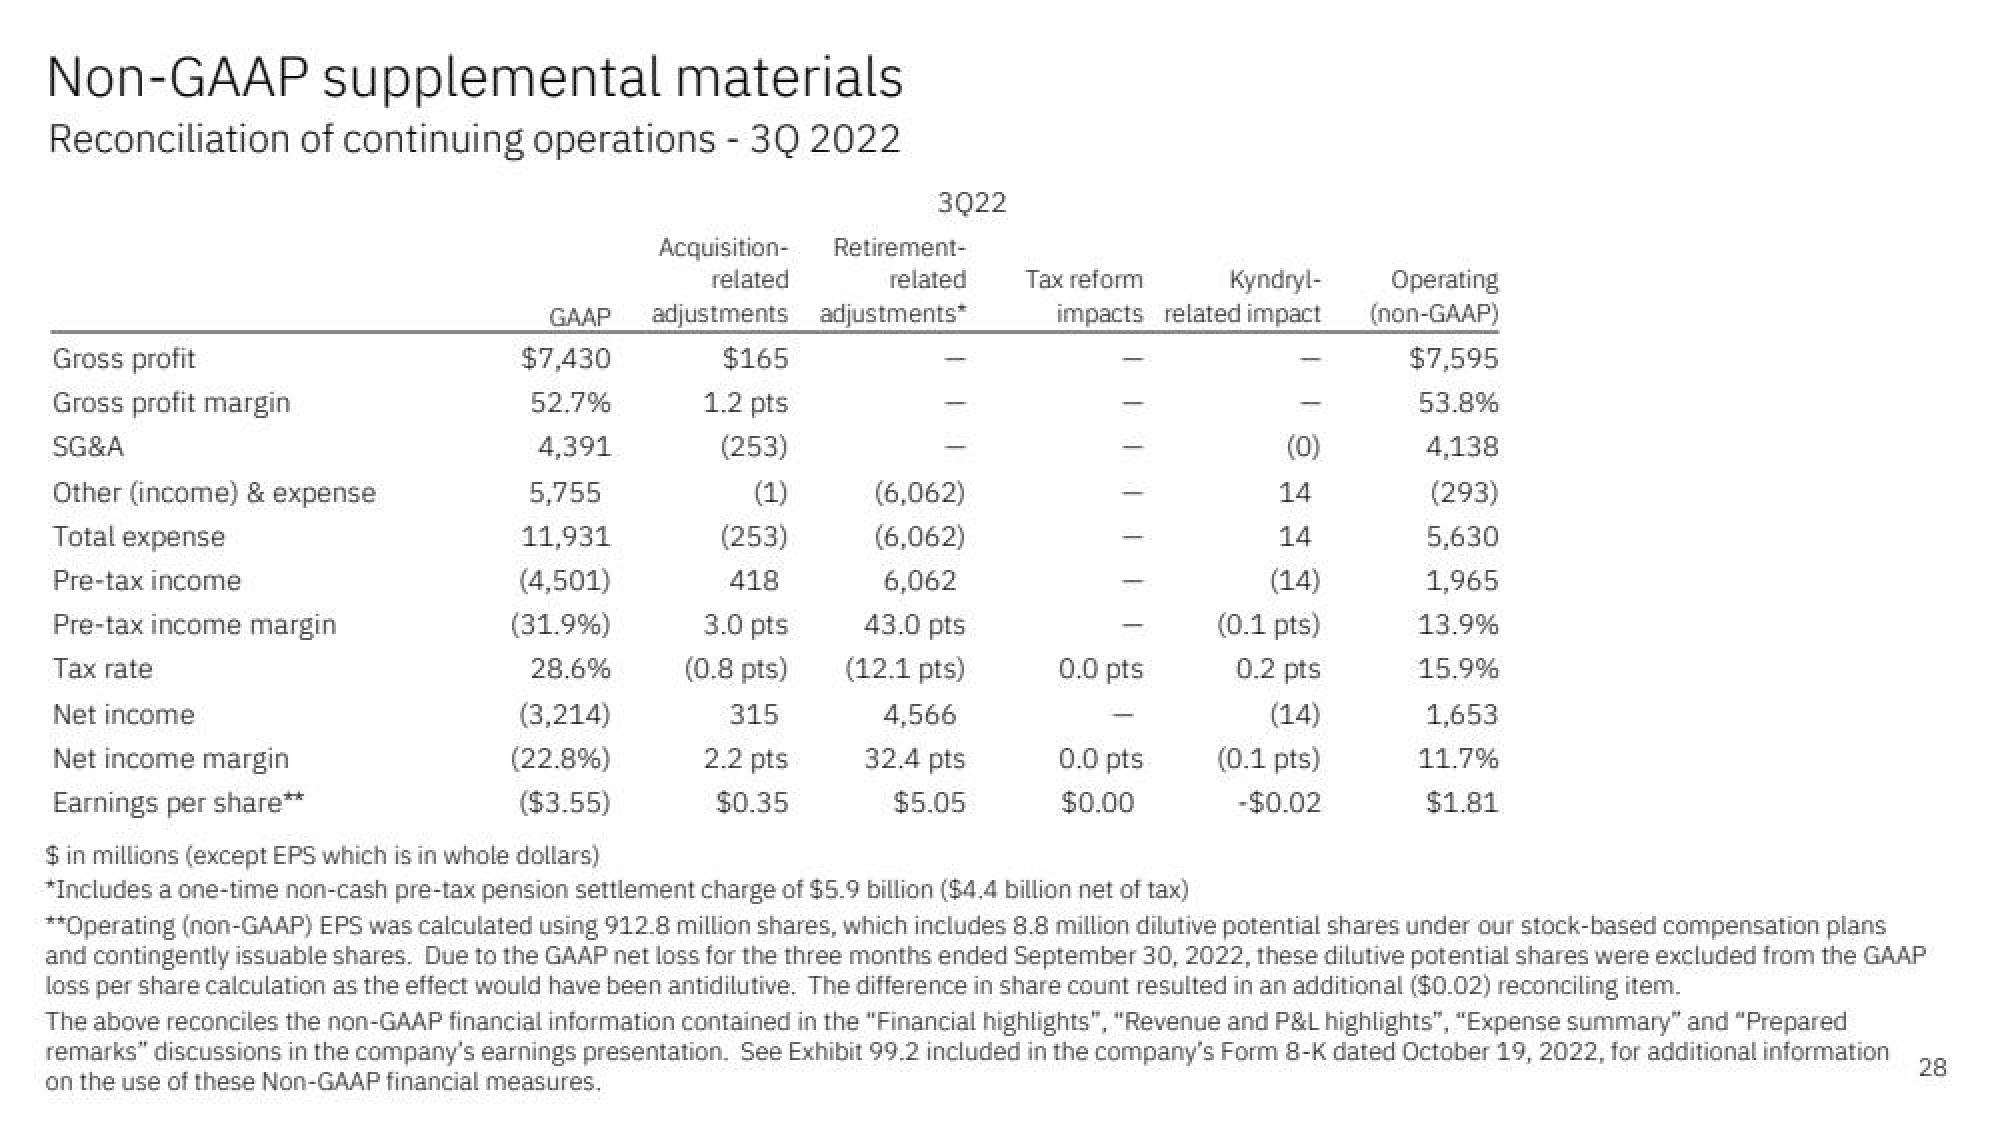
Reconciliation of continuing operations - 3Q 2022
Gross profit
Gross profit margin
SG&A
Other (income) & expense
Total expense
Pre-tax income
Pre-tax income margin
Tax rate
Net income
Net income margin
Earnings per share**
GAAP adjustments
$7,430
52.7%
4,391
Acquisition-
related
5,755
11,931
(4,501)
(31.9%)
28.6%
(3,214)
(22.8%)
($3.55)
$165
1.2 pts
(253)
(1)
(253)
418
3.0 pts
(0.8 pts)
315
2.2 pts
$0.35
3022
Retirement-
related
adjustments*
(6,062)
(6,062)
6,062
43.0 pts
(12.1 pts)
4,566
32.4 pts
$5.05
Kyndryl-
impacts related impact
Tax reform
0.0 pts
0.0 pts
$0.00
(0)
14
14
(14)
(0.1 pts)
0.2 pts
(14)
(0.1 pts)
-$0.02
Operating
(non-GAAP)
$7,595
53.8%
4,138
(293)
5,630
1,965
13.9%
15.9%
1,653
11.7%
$1.81
$ in millions (except EPS which is in whole dollars)
*Includes a one-time non-cash pre-tax pension settlement charge of $5.9 billion ($4.4 billion net of tax)
**Operating (non-GAAP) EPS was calculated using 912.8 million shares, which includes 8.8 million dilutive potential shares under our stock-based compensation plans
and contingently issuable shares. Due to the GAAP net loss for the three months ended September 30, 2022, these dilutive potential shares were excluded from the GAAP
loss per share calculation as the effect would have been antidilutive. The difference in share count resulted in an additional ($0.02) reconciling item.
The above reconciles the non-GAAP financial information contained in the "Financial highlights", "Revenue and P&L highlights", "Expense summary" and "Prepared
remarks" discussions in the company's earnings presentation. See Exhibit 99.2 included in the company's Form 8-K dated October 19, 2022, for additional information
on the use of these Non-GAAP financial measures.
28View entire presentation