First Merchants Investor Presentation Deck
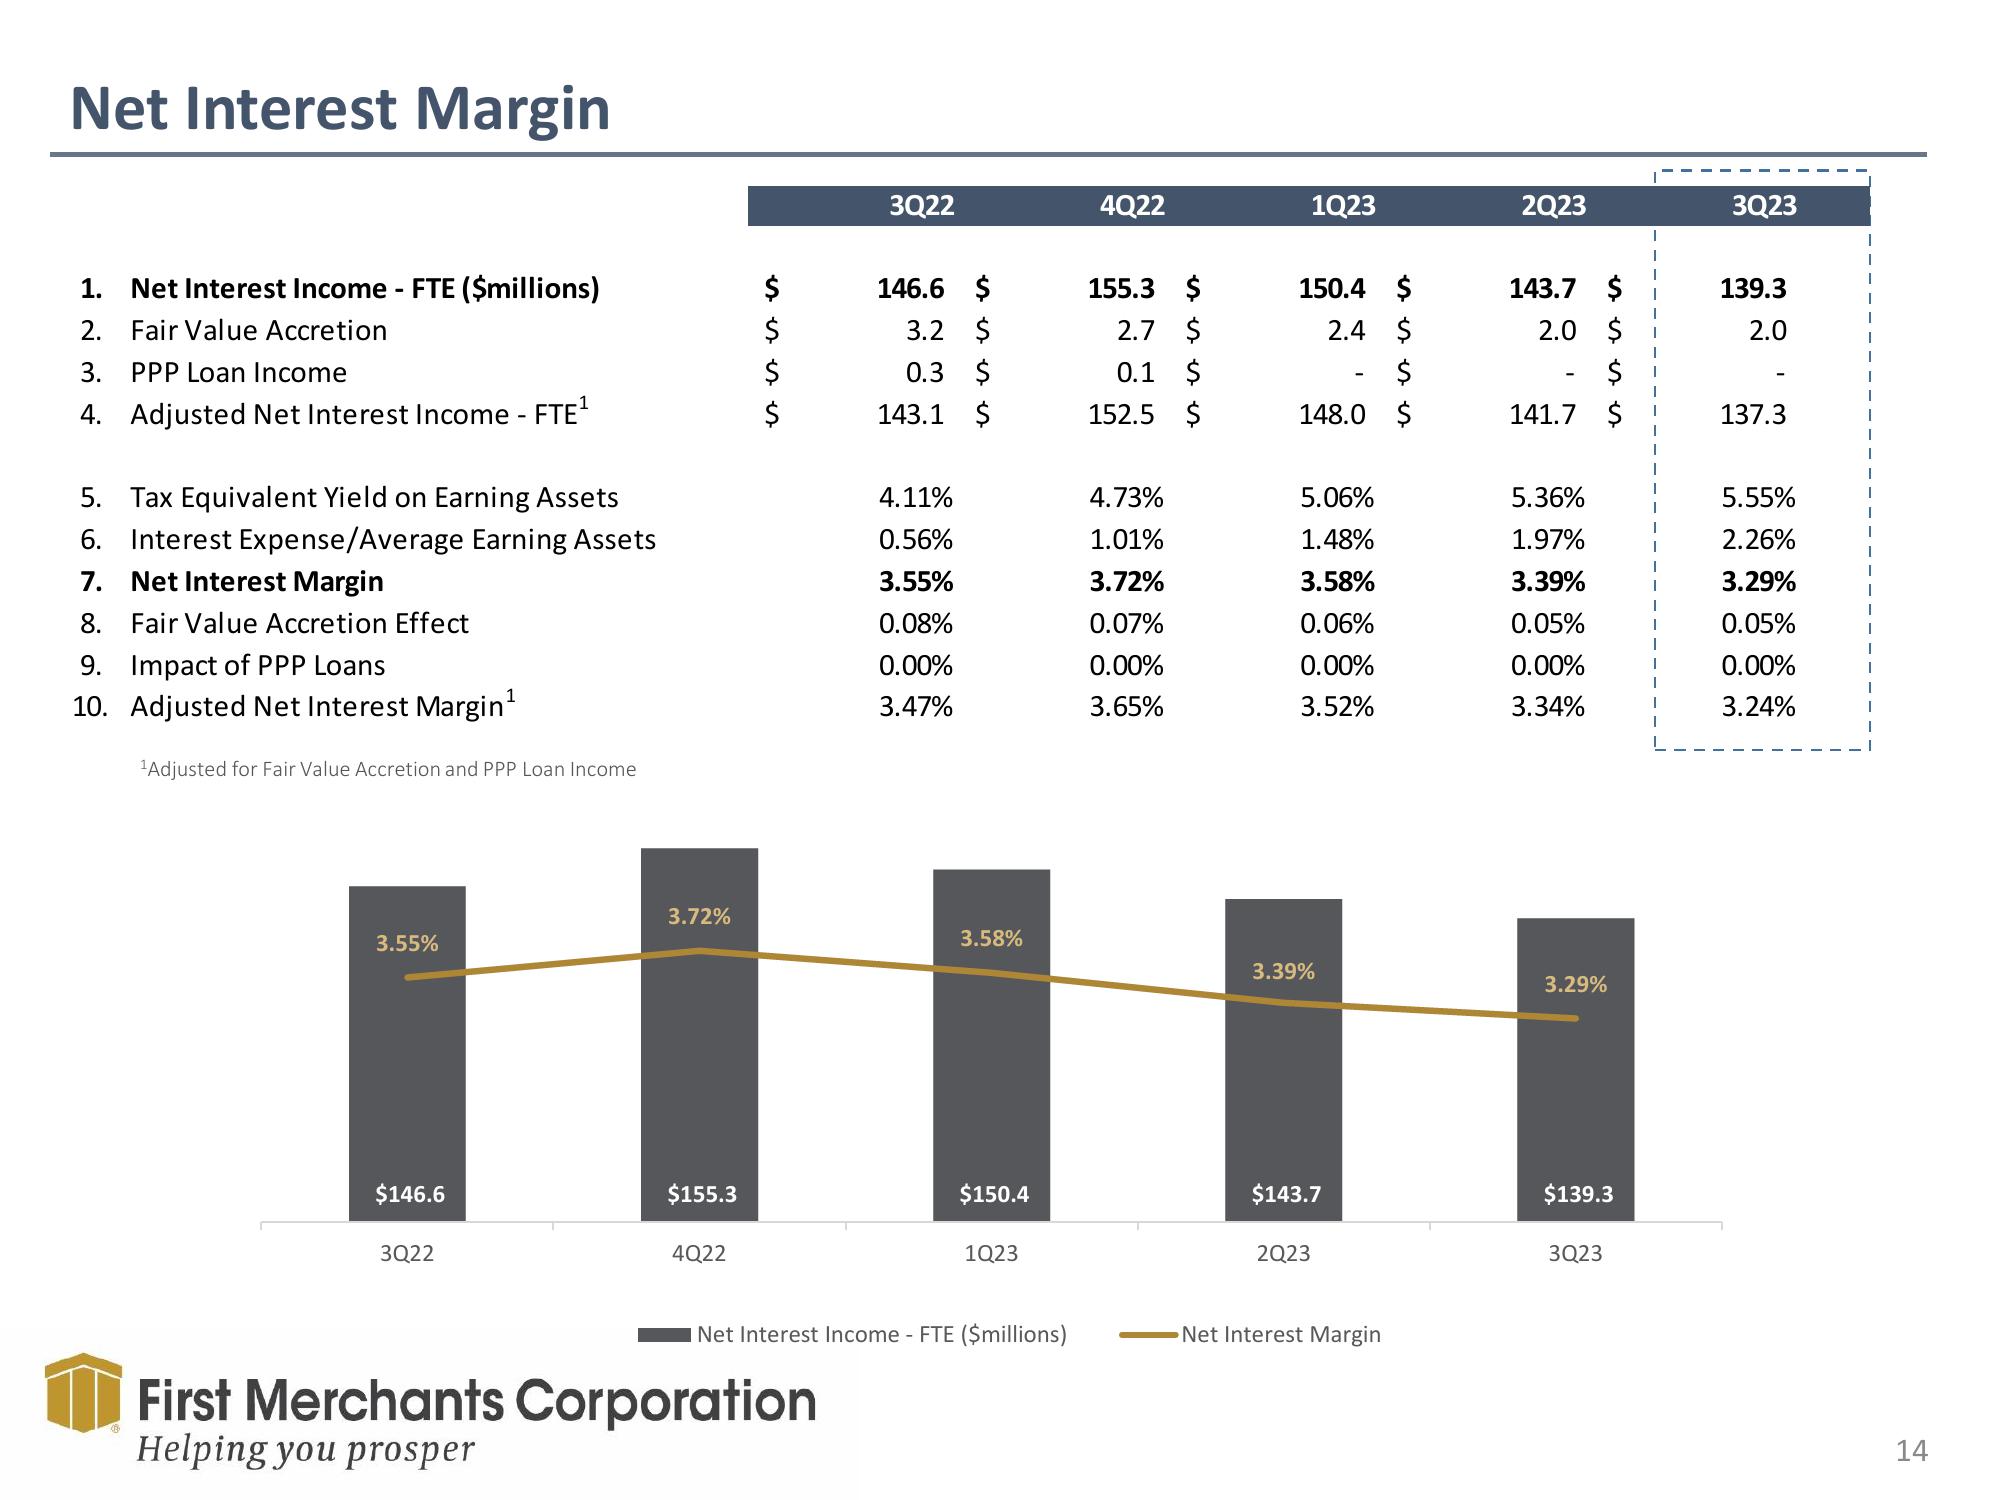
Net Interest Margin
Net Interest Income - FTE ($millions)
1.
2. Fair Value Accretion
PPP Loan Income
3.
4. Adjusted Net Interest Income - FTE¹
5. Tax Equivalent Yield on Earning Assets
6. Interest Expense/Average Earning Assets
7.
Net Interest Margin
8.
Fair Value Accretion Effect
9. Impact of PPP Loans
10. Adjusted Net Interest Margin¹
¹Adjusted for Fair Value Accretion and PPP Loan Income
3.55%
$146.6
3Q22
3.72%
$155.3
4Q22
$
$
3Q22
First Merchants Corporation
Helping you prosper
146.6 $
3.2 $
0.3 $
143.1 $
4.11%
0.56%
3.55%
0.08%
0.00%
3.47%
3.58%
$150.4
1Q23
Net Interest Income - FTE ($millions)
4Q22
155.3 $
2.7 $
0.1 $
152.5 $
4.73%
1.01%
3.72%
0.07%
0.00%
3.65%
1Q23
150.4 $
2.4 $
$
148.0 $
5.06%
1.48%
3.58%
0.06%
0.00%
3.52%
3.39%
$143.7
2Q23
Net Interest Margin
es s
2Q23
143.7 $
2.0 $
$
141.7 $
5.36%
1.97%
3.39%
0.05%
0.00%
3.34%
3.29%
$139.3
3Q23
1
1
1
L
3Q23
139.3
2.0
137.3
5.55%
2.26%
3.29%
0.05%
0.00%
3.24%
1
14View entire presentation