AG Direct Lending SMA
ANGELO
GORDON
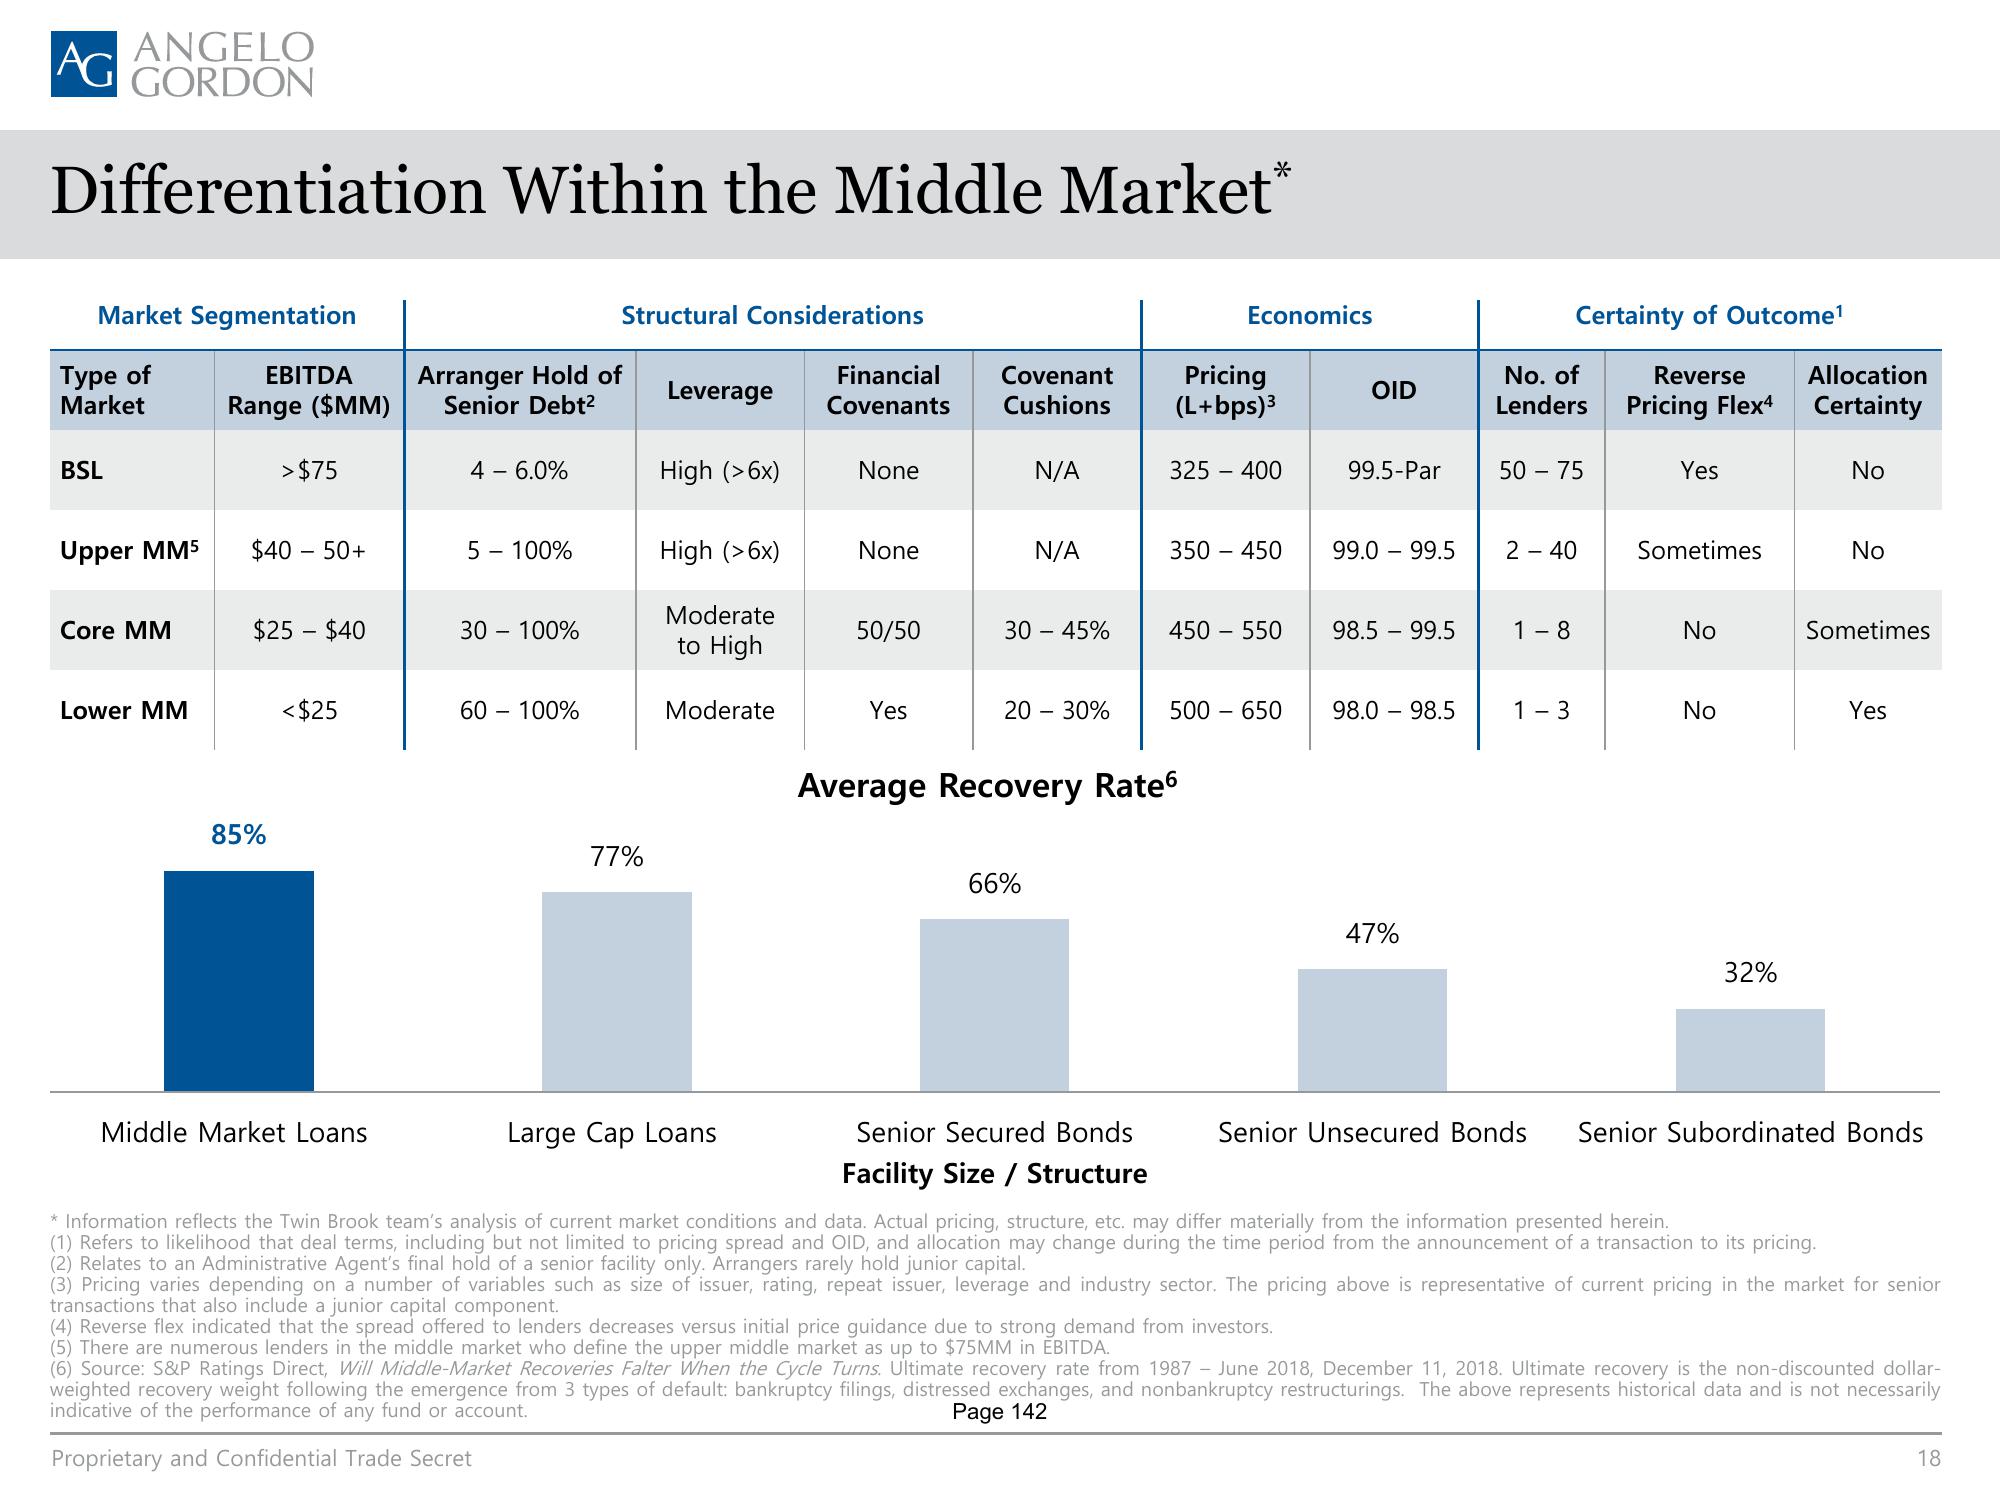
Differentiation Within the Middle Market*
Market Segmentation
Type of
Market
BSL
Upper MM5
Core MM
Lower MM
EBITDA
Range ($MM)
>$75
$40 - 50+
$25 - $40
85%
<$25
Middle Market Loans
Arranger Hold of
Senior Debt²
4 - 6.0%
5 - 100%
30 - 100%
Structural Considerations
60 - 100%
77%
Leverage
High (>6x)
High (>6x)
Moderate
to High
Moderate
Large Cap Loans
Financial
Covenants
None
None
50/50
Yes
Covenant
Cushions
N/A
N/A
30-45%
20 - 30%
66%
Average Recovery Rate
Senior Secured Bonds
Facility Size / Structure
Economics
Pricing
(L+bps) ³
325 - 400
350 - 450
450-550
500 - 650
OID
99.5-Par
99.0 - 99.5
98.5 - 99.5
98.0 - 98.5
47%
No. of
Lenders
Certainty of Outcome¹
Reverse
Pricing Flex4
50 - 75
2 - 40
1-8
1-3
Yes
Sometimes
No
No
32%
Allocation
Certainty
No
No
Sometimes
Yes
Senior Unsecured Bonds Senior Subordinated Bonds
* Information reflects the Twin Brook team's analysis of current market conditions and data. Actual pricing, structure, etc. may differ materially from the information presented herein.
(1) Refers to likelihood that deal terms, including but not limited to pricing spread and OID, and allocation may change during the time period from the announcement of a transaction to its pricing.
(2) Relates to an Administrative Agent's final hold of a senior facility only. Arrangers rarely hold junior capital.
(3)
varies depending on a number of variables such as size of issuer, rating, repeat issuer, leverage and ind sector. The pricing above is representative of current pricing in the market for senior
transactions that also include a junior capital component.
(4) Reverse flex indicated that the spread offered to lenders decreases versus initial price guidance due to strong demand from investors.
(5) There are numerous lenders in the middle market who define the upper middle market as up to $75MM in EBITDA.
(6) Source: S&P Ratings Direct, Will Middle-Market Recoveries Falter When the Cycle Turns. Ultimate recovery rate from 1987 - June 2018, December 11, 2018. Ultimate recovery is the non-discounted dollar-
weighted recovery weight following the emergence from 3 types of default: bankruptcy filings, distressed exchanges, and nonbankruptcy restructurings. The above represents historical data and is not necessarily
indicative of the performance of any fund or account.
Page 142
Proprietary and Confidential Trade Secret
18View entire presentation