Bausch+Lomb Results Presentation Deck slide image

Bausch+Lomb Results Presentation Deck

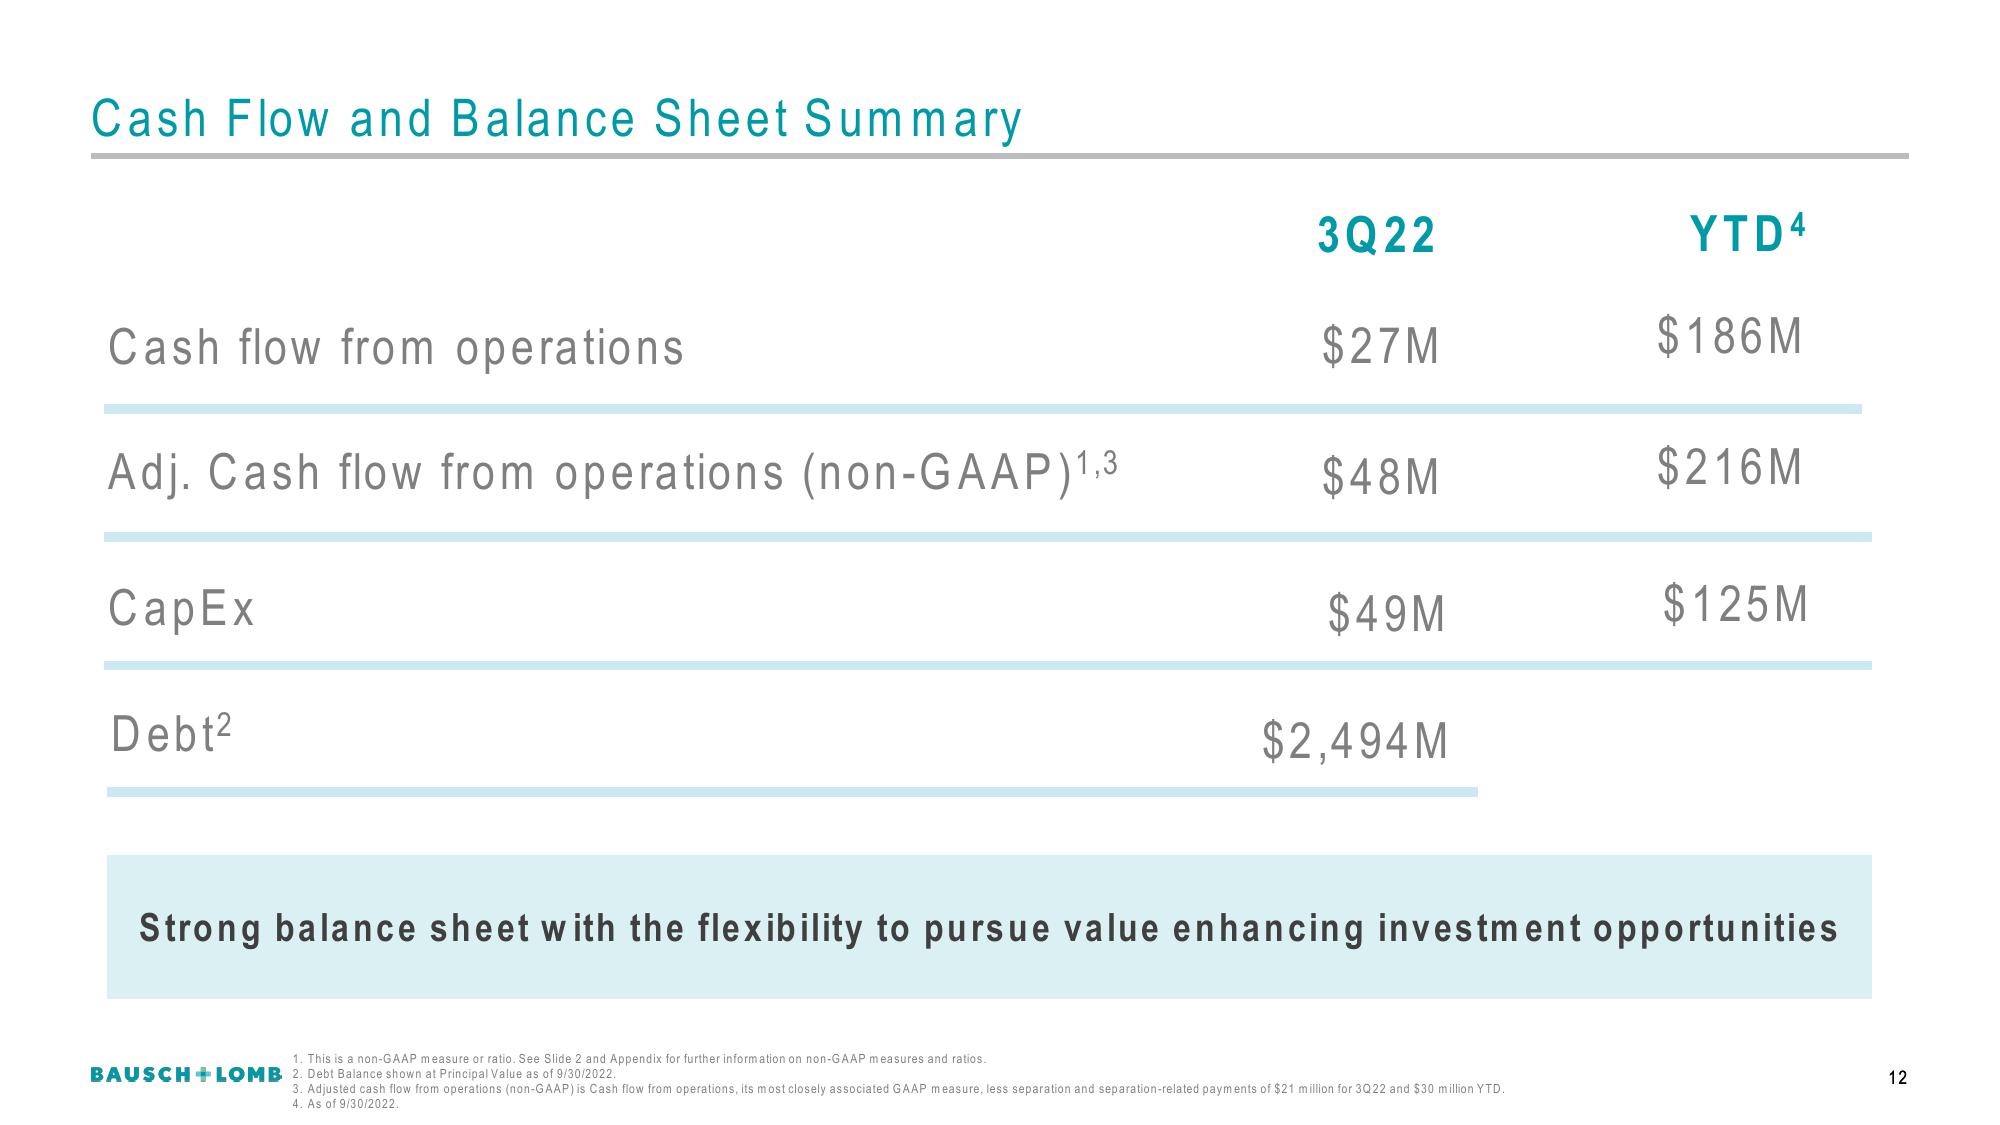
Cash Flow and Balance Sheet Summary Cash flow from operations. Adj. Cash flow from operations (non-GAAP)1,3 CapEx Debt² 1. This is a non-GAAP measure or ratio. See Slide 2 and Appendix for further information on non-GAAP measures and ratios. 3Q22 BAUSCH + LOMB 2. Debt Balance shown at Principal Value as of 9/30/2022. $27M $48M $49M $2,494M YTD4 $186M Strong balance sheet with the flexibility to pursue value enhancing investment opportunities 3. Adjusted cash flow from operations (non-GAAP) is Cash flow from operations, its most closely associated GAAP measure, less separation and separation-related payments of $21 million for 3Q22 and $30 million YTD. 4. As of 9/30/2022. $216M $125M 12
View entire presentation