TPG Investor Presentation Deck
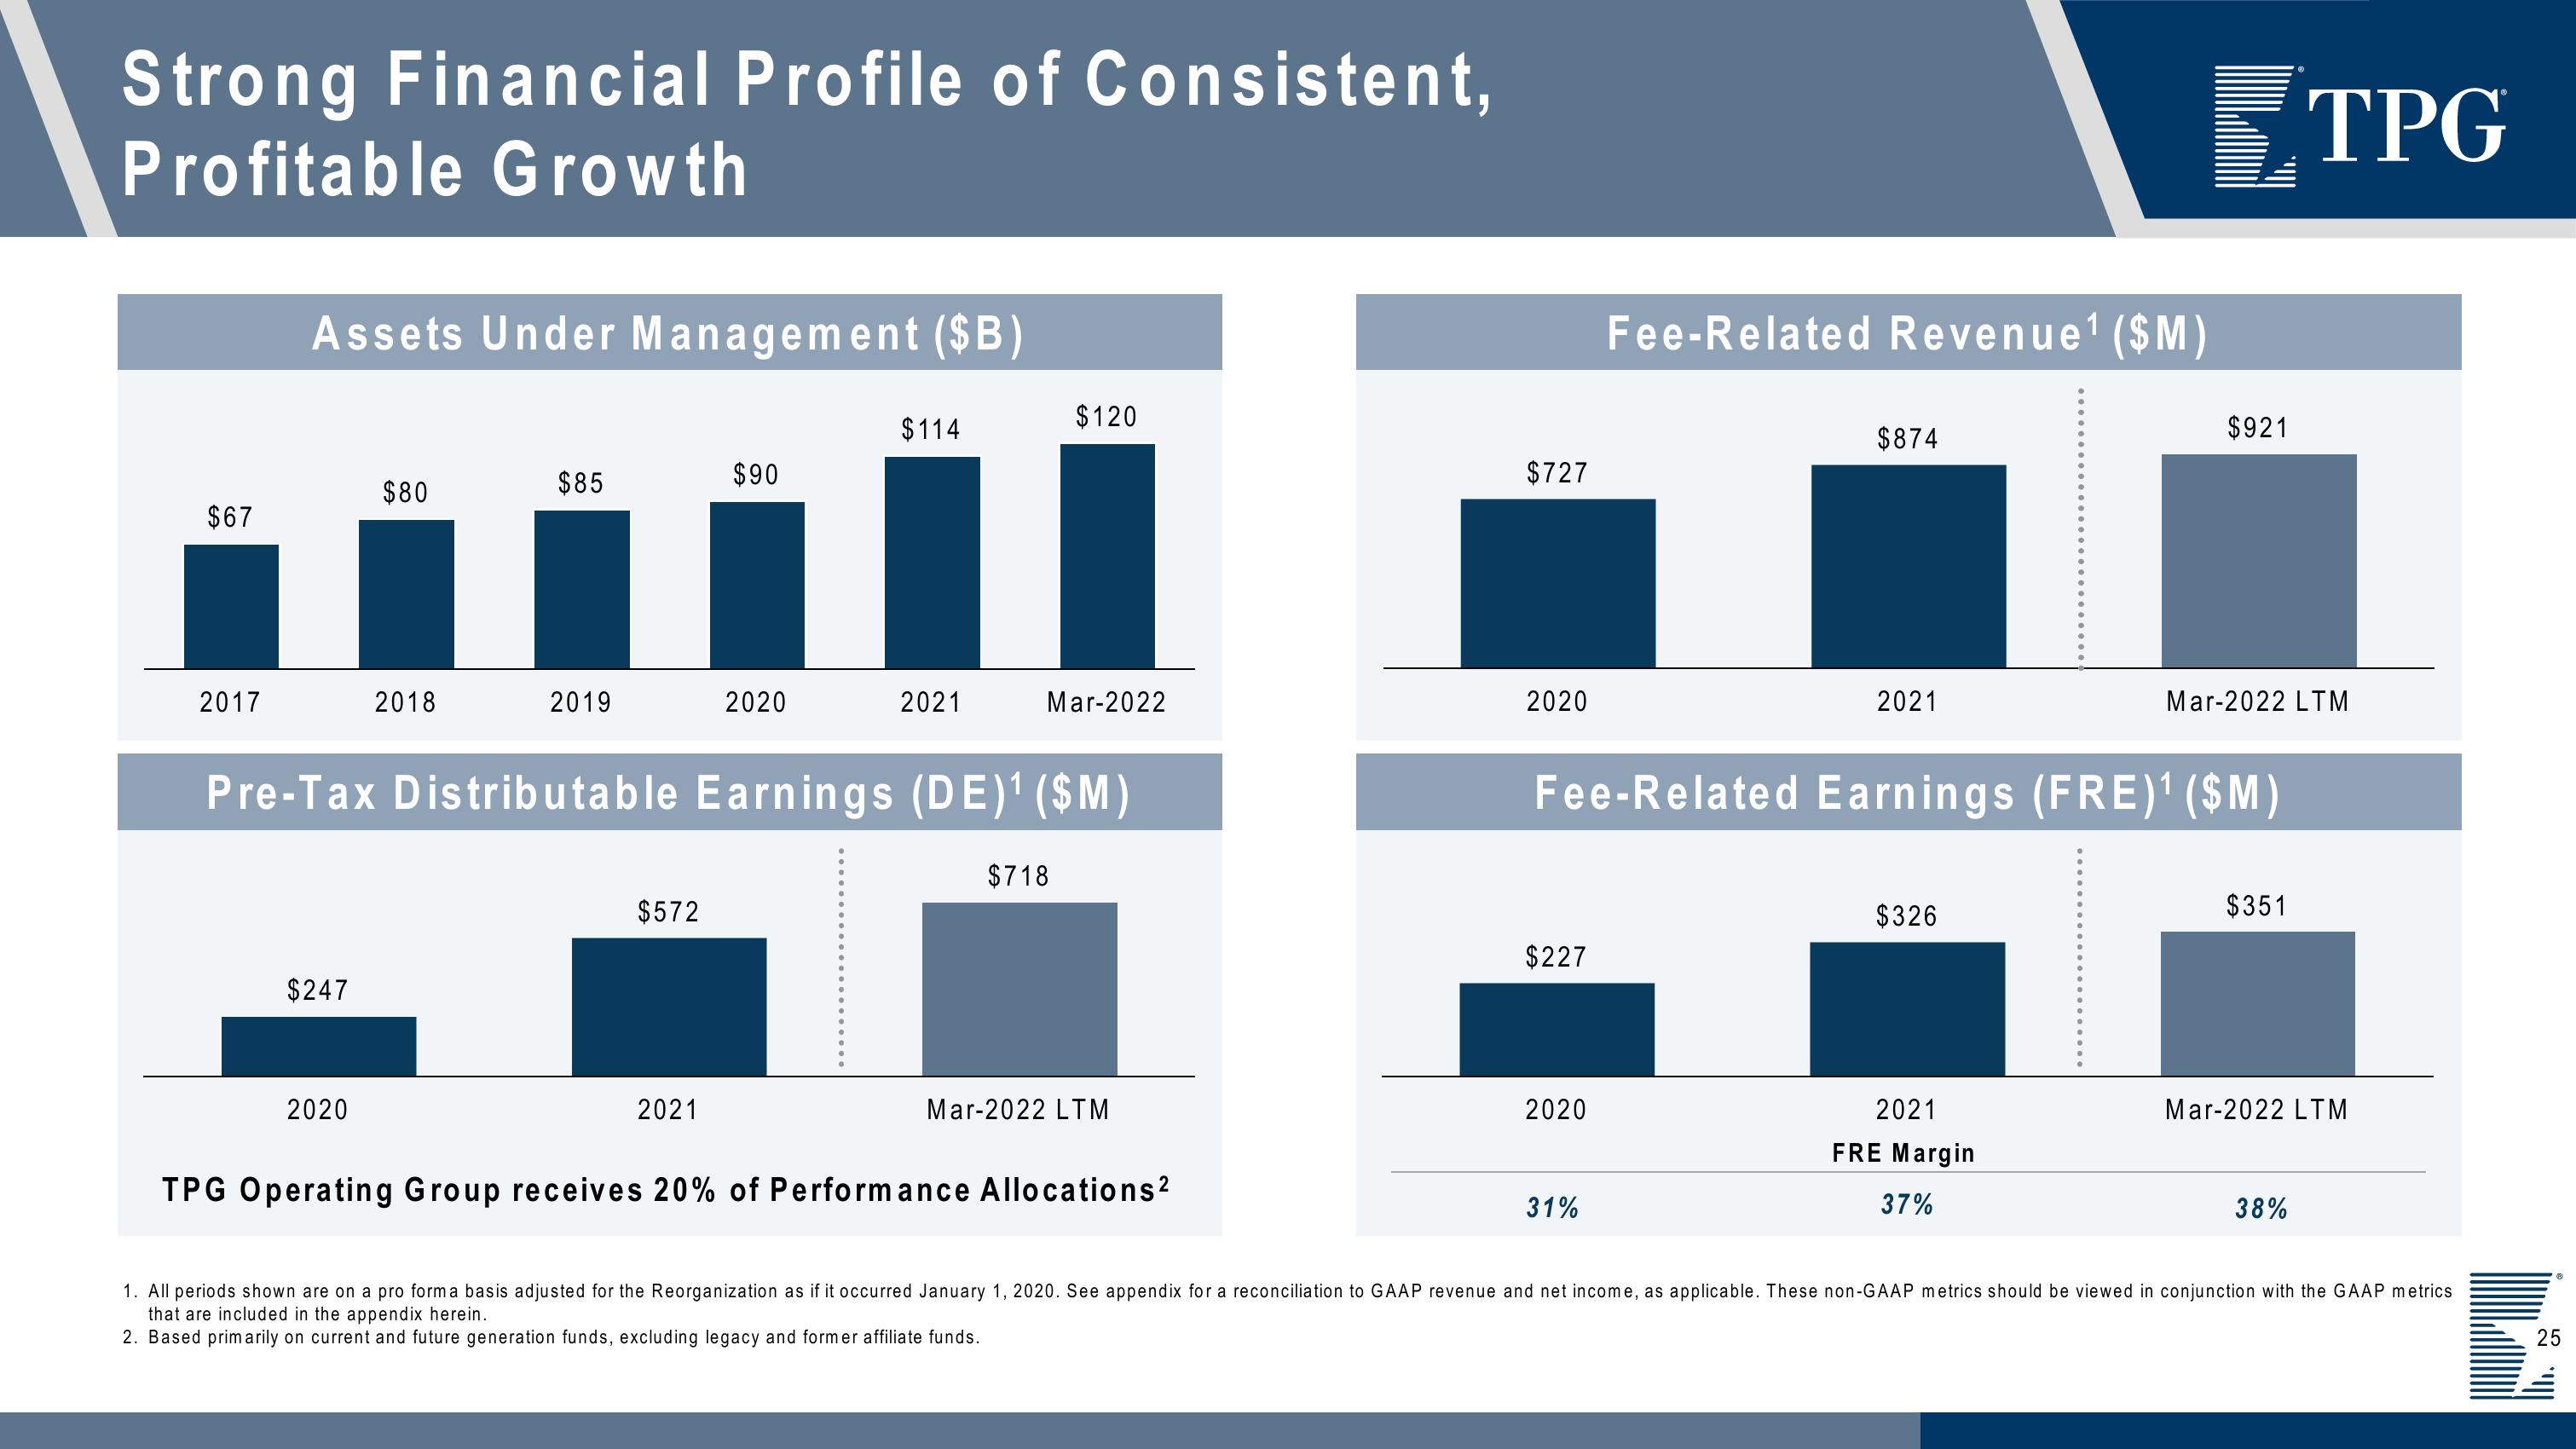
Strong Financial Profile of Consistent,
Profitable Growth
$67
2017
Assets Under Management ($B)
$247
$80
2020
2018
$85
2019
$572
$90
2021
2020
$114
Pre-Tax Distributable Earnings (DE)¹ ($M)
2021
$120
Mar-2022
$718
Mar-2022 LTM
TPG Operating Group receives 20% of Performance Allocations ²
$727
2020
$227
2020
Fee-Related Revenue ¹ ($M)
31%
$874
2021
Fee-Related Earnings (FRE)¹ ($M)
$326
$921
2021
FRE Margin
37%
Mar-2022 LTM
$351
TPG
Mar-2022 LTM
38%
1. All periods shown are on a pro form a basis adjusted for the Reorganization as if it occurred January 1, 2020. See appendix for a reconciliation to GAAP revenue and net income, as applicable. These non-GAAP metrics should be viewed in conjunction with the GAAP metrics
that are included in the appendix herein.
2. Based primarily on current and future generation funds, excluding legacy and former affiliate funds.
25View entire presentation