TPG Results Presentation Deck
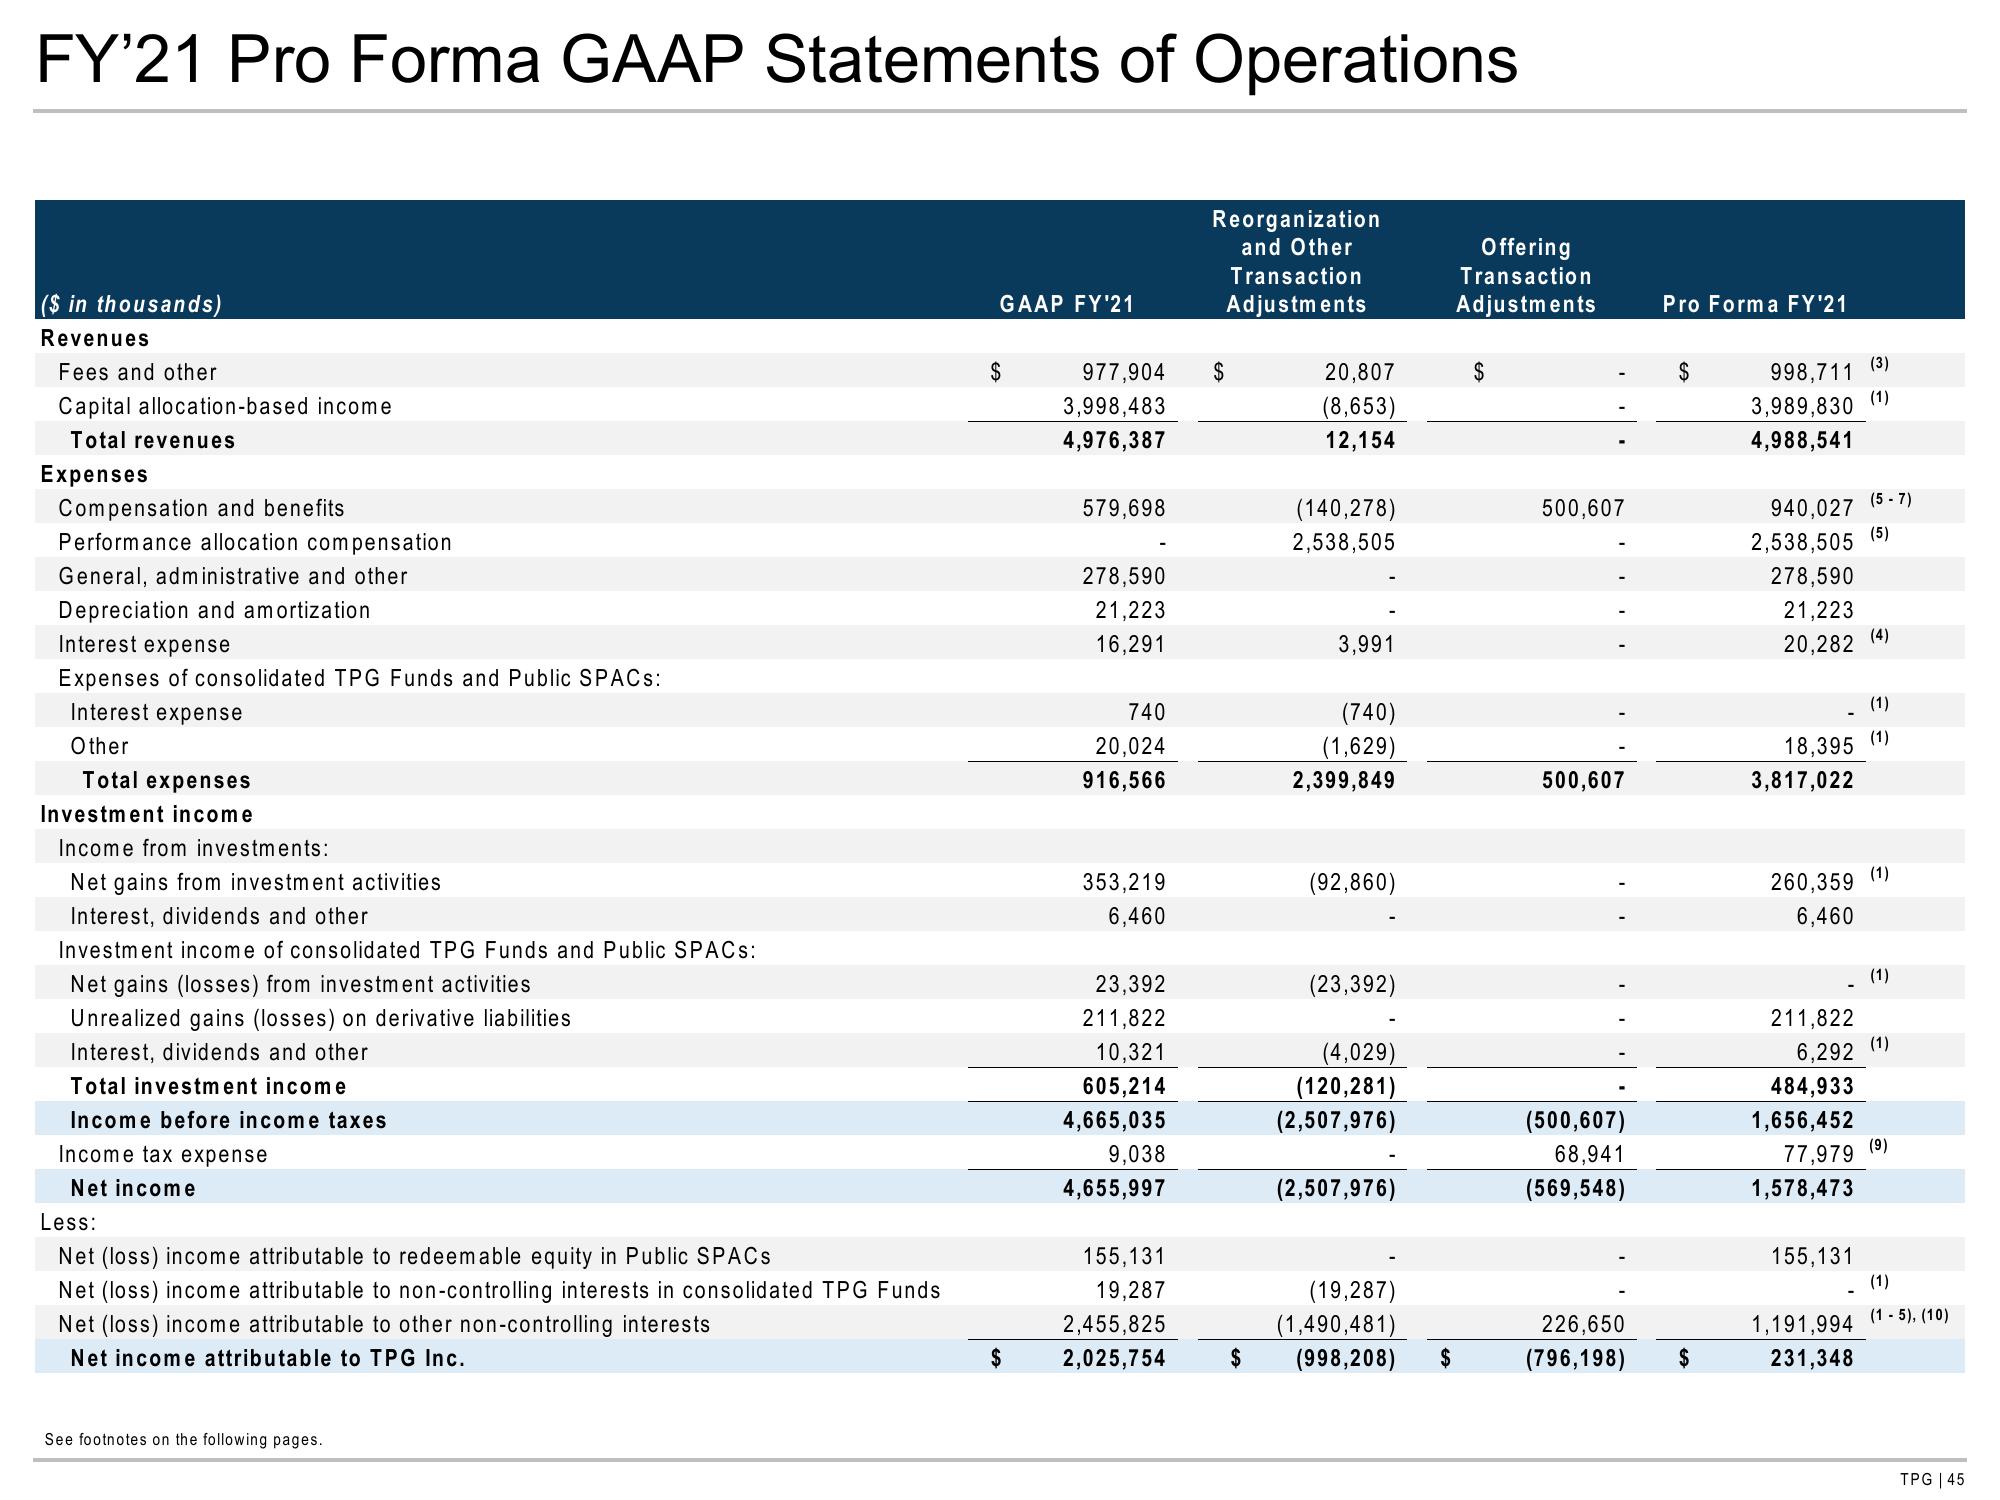
FY'21 Pro Forma GAAP Statements of Operations
($ in thousands)
Revenues
Fees and other
Capital allocation-based income
Total revenues
Expenses
Compensation and benefits
Performance allocation compensation
General, administrative and other
Depreciation and amortization
Interest expense
Expenses of consolidated TPG Funds and Public SPACS:
Interest expense
Other
Total expenses
Investment income
Income from investments:
Net gains from investment activities
Interest, dividends and other
Investment income of consolidated TPG Funds and Public SPACs:
Net gains (losses) from investment activities
Unrealized gains (losses) on derivative liabilities
Interest, dividends and other
Total investment income
Income before income taxes
Income tax expense
Net income
Less:
Net (loss) income attributable to redeemable equity in Public SPACS
Net (loss) income attributable to non-controlling interests in consolidated TPG Funds
Net (loss) income attributable to other non-controlling interests
Net income attributable to TPG Inc.
See footnotes on the following pages.
GAAP FY'21
$
$
977,904 $
3,998,483
4,976,387
579,698
278,590
21,223
16,291
740
20,024
916,566
353,219
6,460
23,392
211,822
10,321
605,214
4,665,035
9,038
4,655,997
155,131
19,287
Reorganization
and Other
Transaction
Adjustments
2,455,825
2,025,754
20,807
(8,653)
12,154
(140,278)
2,538,505
3,991
(740)
(1,629)
2,399,849
(92,860)
(23,392)
(4,029)
(120,281)
(2,507,976)
(2,507,976)
(19,287)
(1,490,481)
$ (998,208)
$
Offering
Transaction
Adjustments
$
500,607
500,607
(500,607)
68,941
(569,548)
226,650
(796,198)
Pro Forma FY'21
$
998,711
3,989,830
4,988,541
940,027
2,538,505
278,590
21,223
18,395
3,817,022
20,282 (4)
260,359
6,460
211,822
6,292
484,933
1,656,452
1,578,473
(3)
(1)
155,131
(5-7)
(5)
1,191,994
231,348
(1)
(1)
(1)
77,979 (9)
(1)
(1)
(1)
(1-5), (10)
TPG | 45View entire presentation