Marti SPAC Presentation Deck
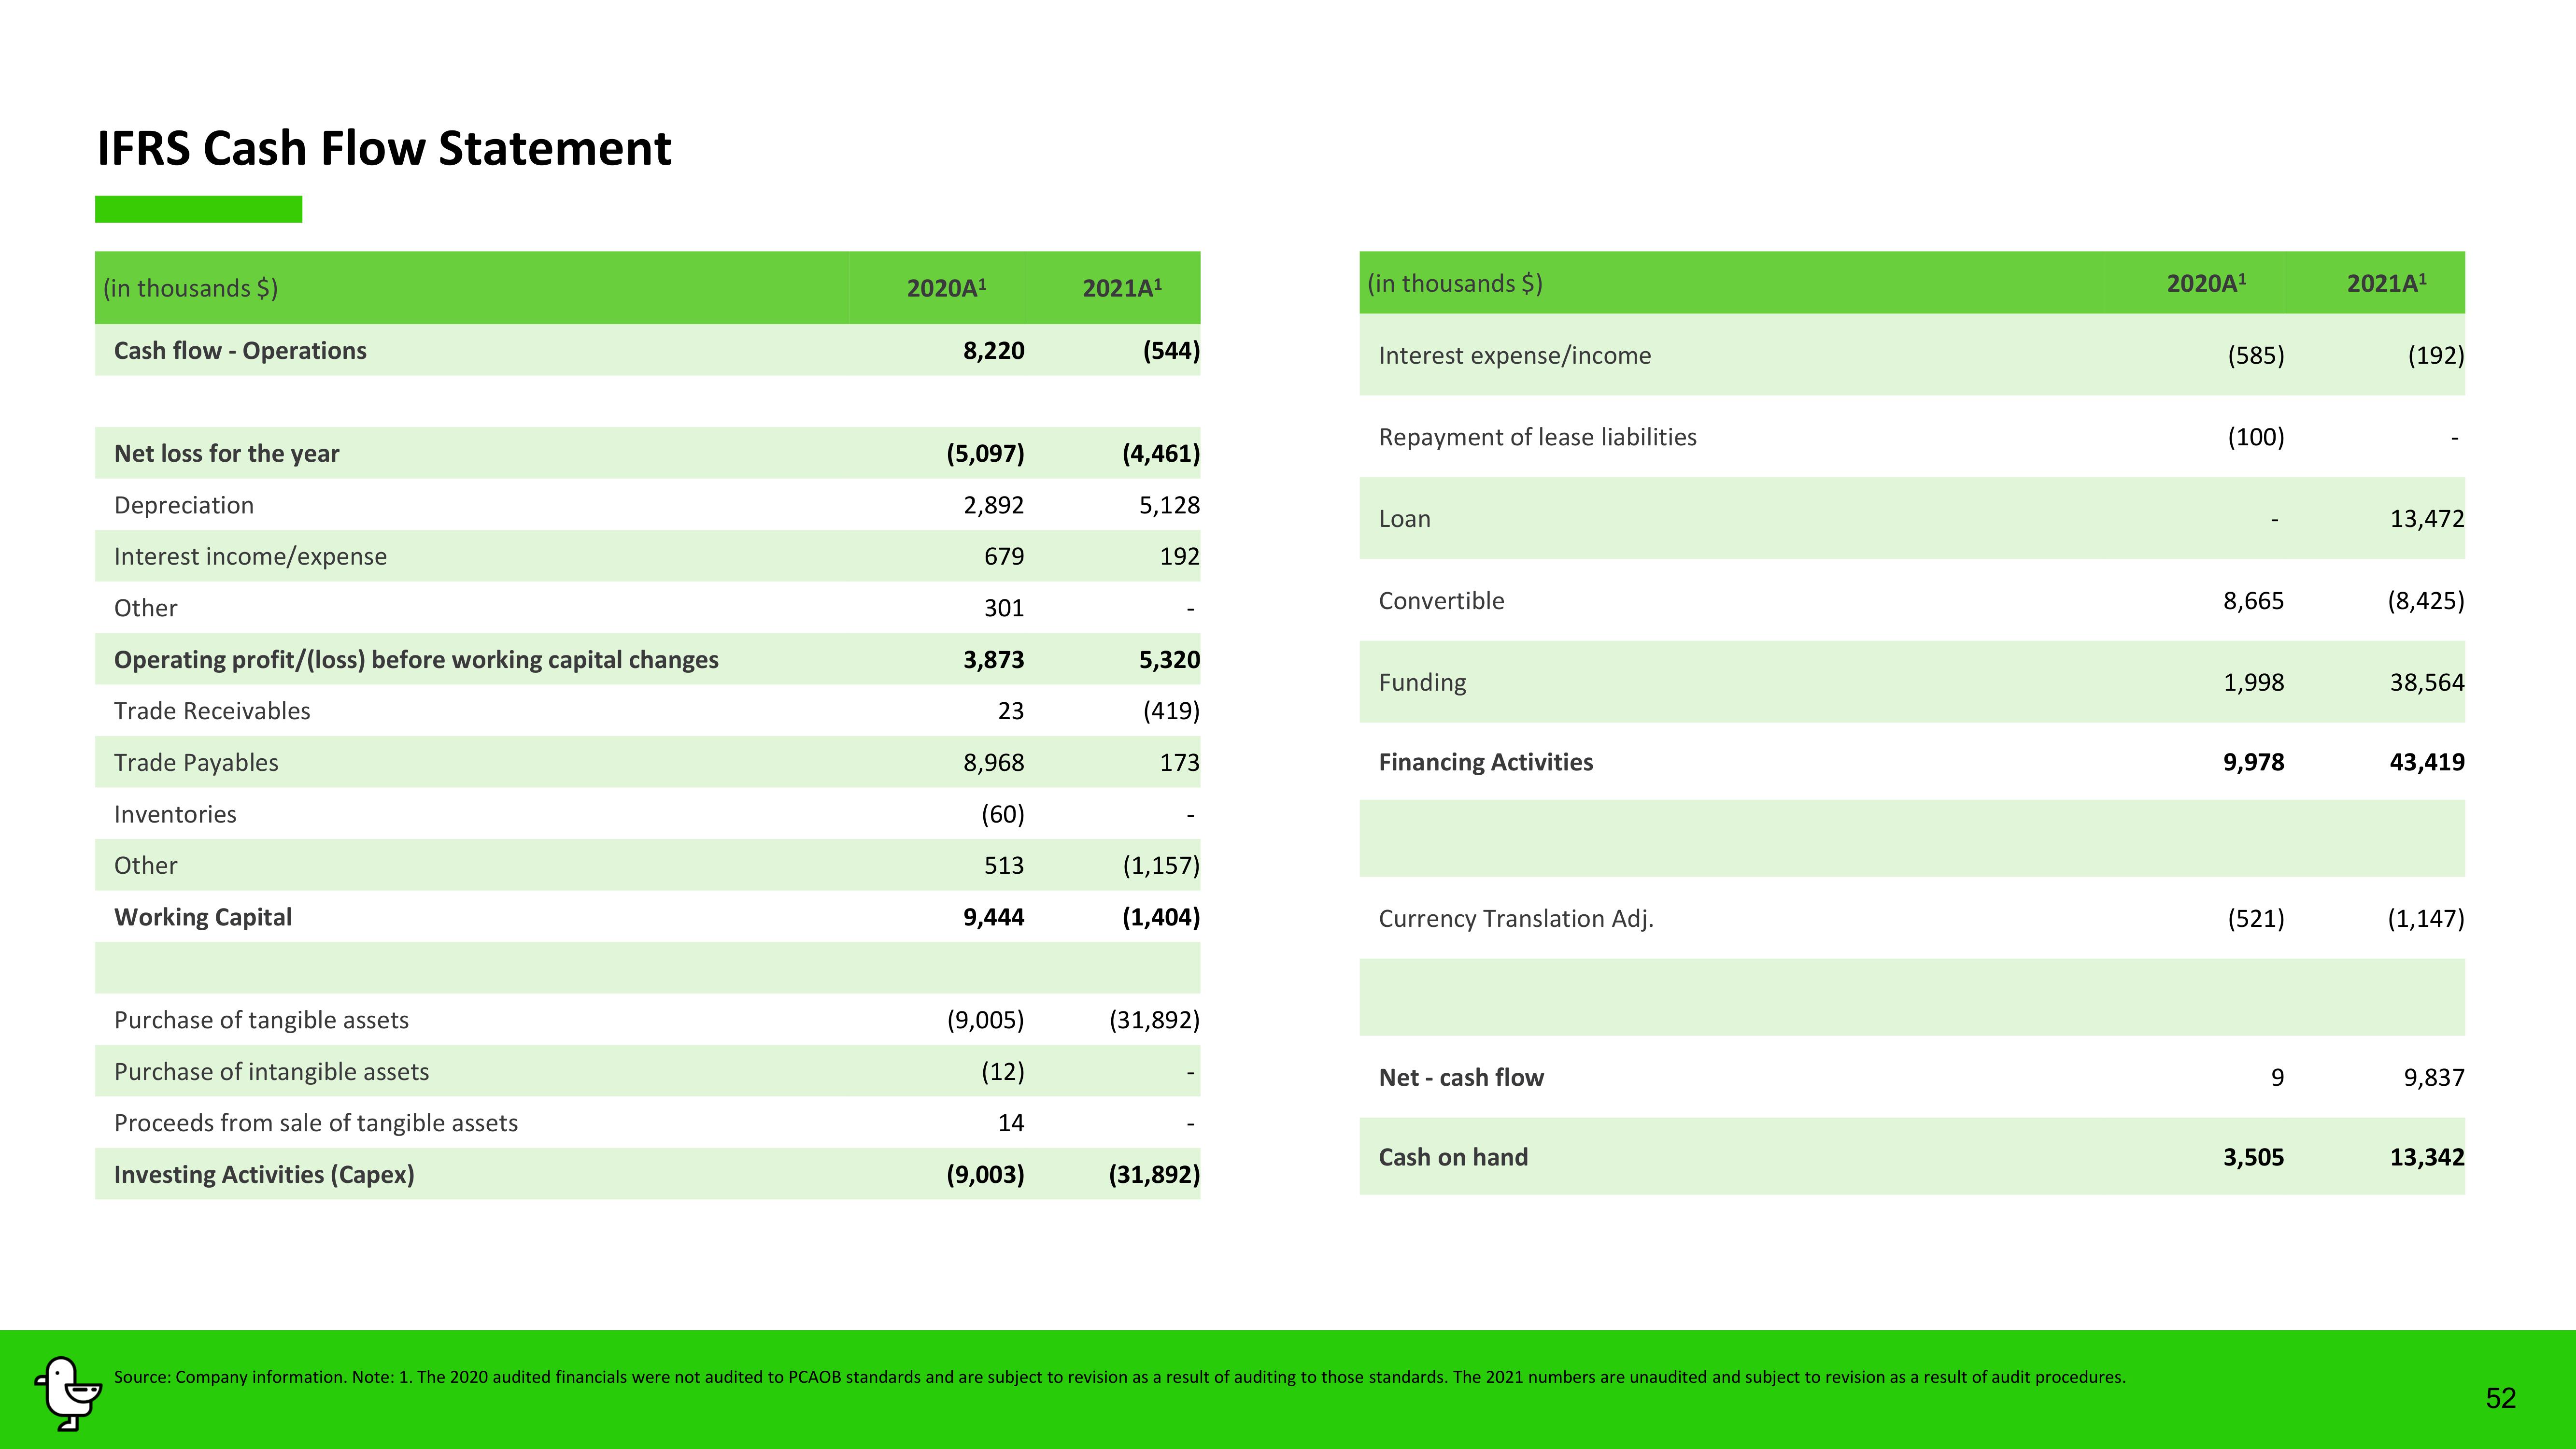
IFRS Cash Flow Statement
(in thousands $)
Cash flow - Operations
Net loss for the year
Depreciation
Interest income/expense
Other
Operating profit/(loss) before working capital changes
Trade Receivables
Trade Payables
Inventories
Other
Working Capital
Purchase of tangible assets
Purchase of intangible assets
Proceeds from sale of tangible assets
Investing Activities (Capex)
2020A¹
8,220
(5,097)
2,892
679
301
3,873
23
8,968
(60)
513
9,444
(9,005)
(12)
14
(9,003)
2021A¹
(544)
(4,461)
5,128
192
5,320
(419)
173
(1,157)
(1,404)
(31,892)
(31,892)
(in thousands $)
Interest expense/income
Repayment of lease liabilities
Loan
Convertible
Funding
Financing Activities
Currency Translation Adj.
Net cash flow
Cash on hand
Source: Company information. Note: 1. The 2020 audited financials were not audited to PCAOB standards and are subject to revision as a result of auditing to those standards. The 2021 numbers are unaudited and subject to revision as a result of audit procedures.
2020A¹
(585)
(100)
8,665
1,998
9,978
(521)
9
3,505
2021A¹
(192)
13,472
(8,425)
38,564
43,419
(1,147)
9,837
13,342
52View entire presentation