Lumen Results Presentation Deck
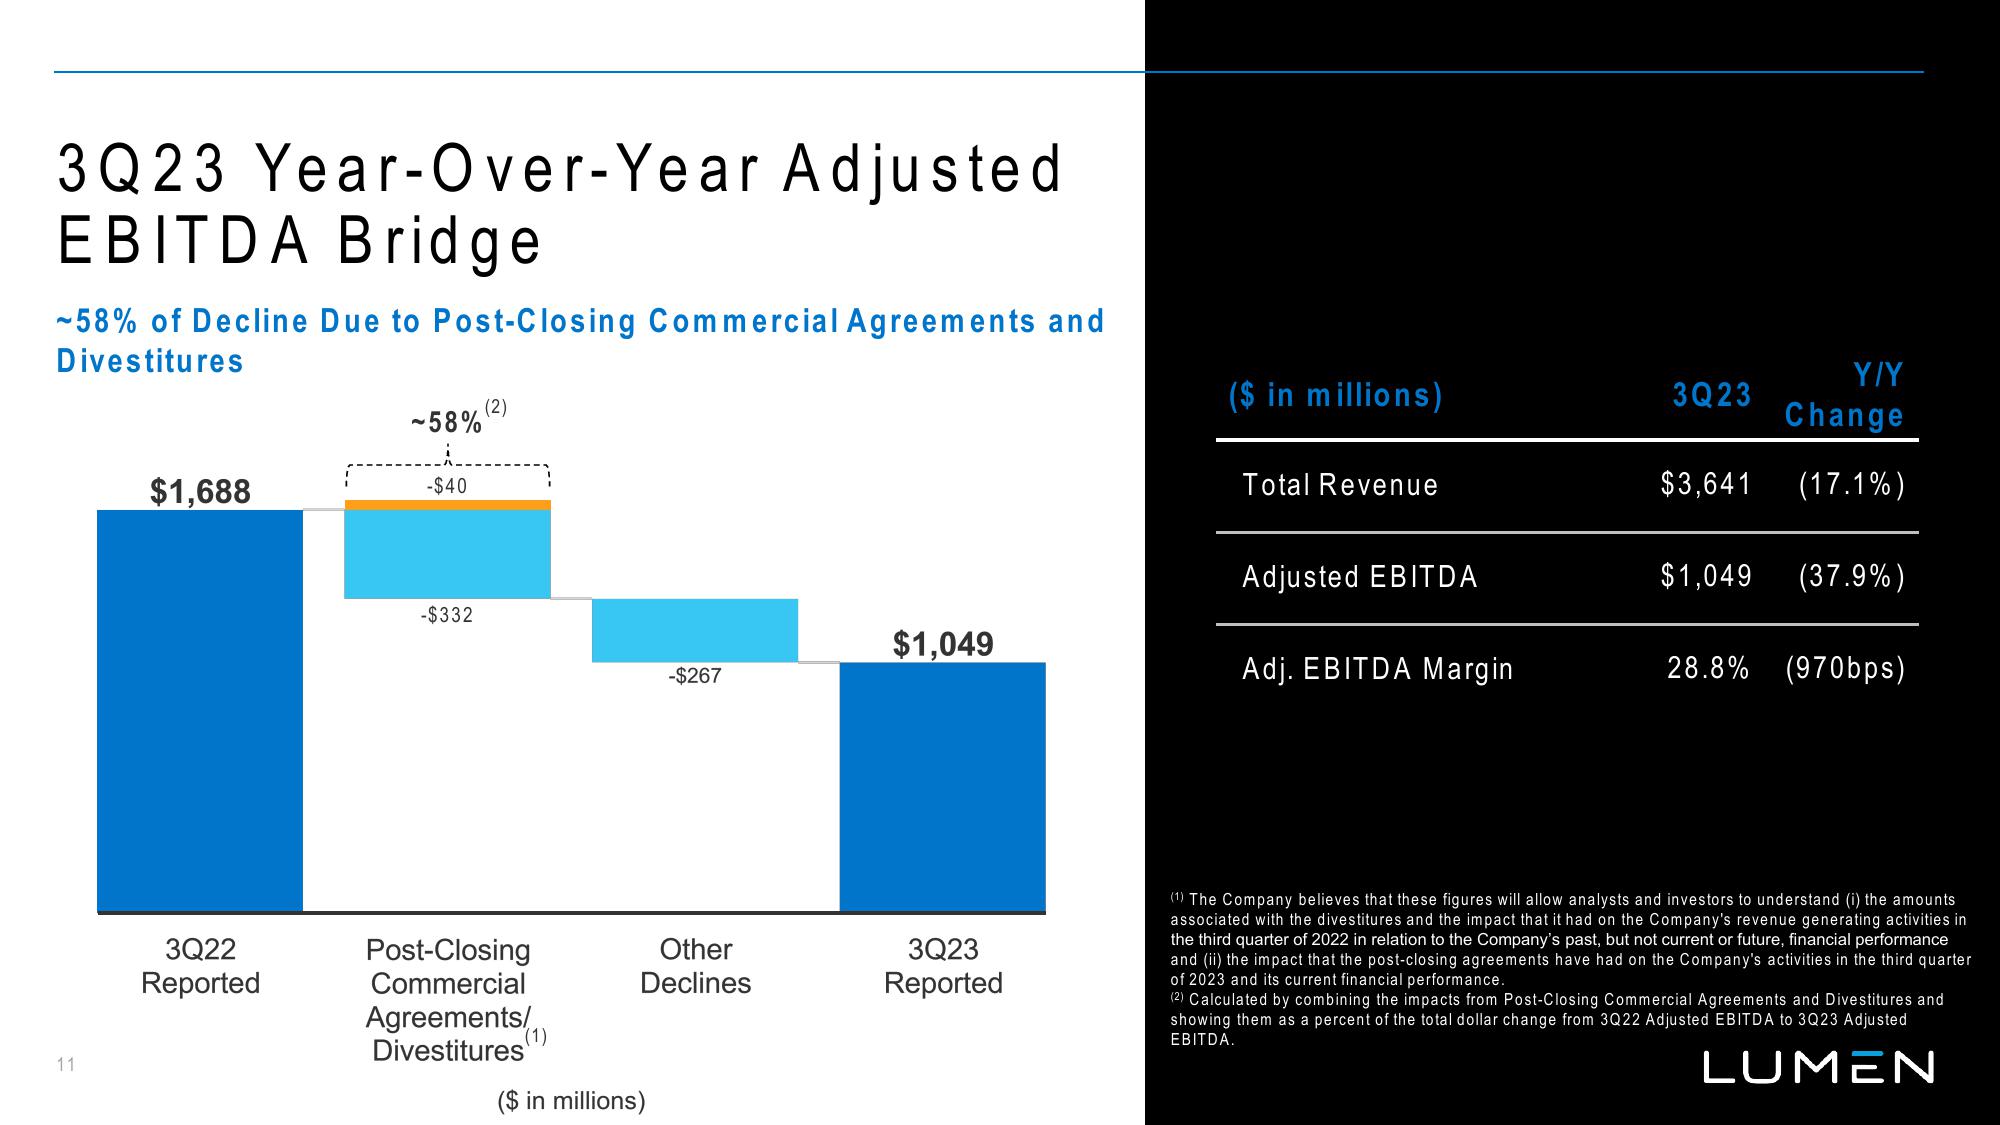
3Q23 Year-Over-Year Adjusted
EBITDA Bridge
-58% of Decline Due to Post-Closing Commercial Agreements and
Divestitures
11
$1,688
3Q22
Reported
-58%
-$40
-$332
(2)
Post-Closing
Commercial
Agreements/
Divestitures (¹)
-$267
Other
Declines
($ in millions)
$1,049
3Q23
Reported
($ in millions)
Total Revenue
Adjusted EBITDA
Adj. EBITDA Margin
Y/Y
Change
$3,641 (17.1%)
3Q23
$1,049 (37.9%)
28.8% (970bps)
(1) The Company believes that these figures will allow analysts and investors to understand (i) the amounts
associated with the divestitures and the impact that it had on the Company's revenue generating activities in
the third quarter of 2022 in relation to the Company's past, but not current or future, financial performance
and (ii) the impact that the post-closing agreements have had on the Company's activities in the third quarter
of 2023 and its current financial performance.
(2) Calculated by combining the impacts from Post-Closing Commercial Agreements and Divestitures and
showing them a percent of the total dollar change from 3Q22 Adjusted EBITDA to 3Q23 Adjusted
EBITDA.
LUMENView entire presentation