Vivid Seats Results Presentation Deck
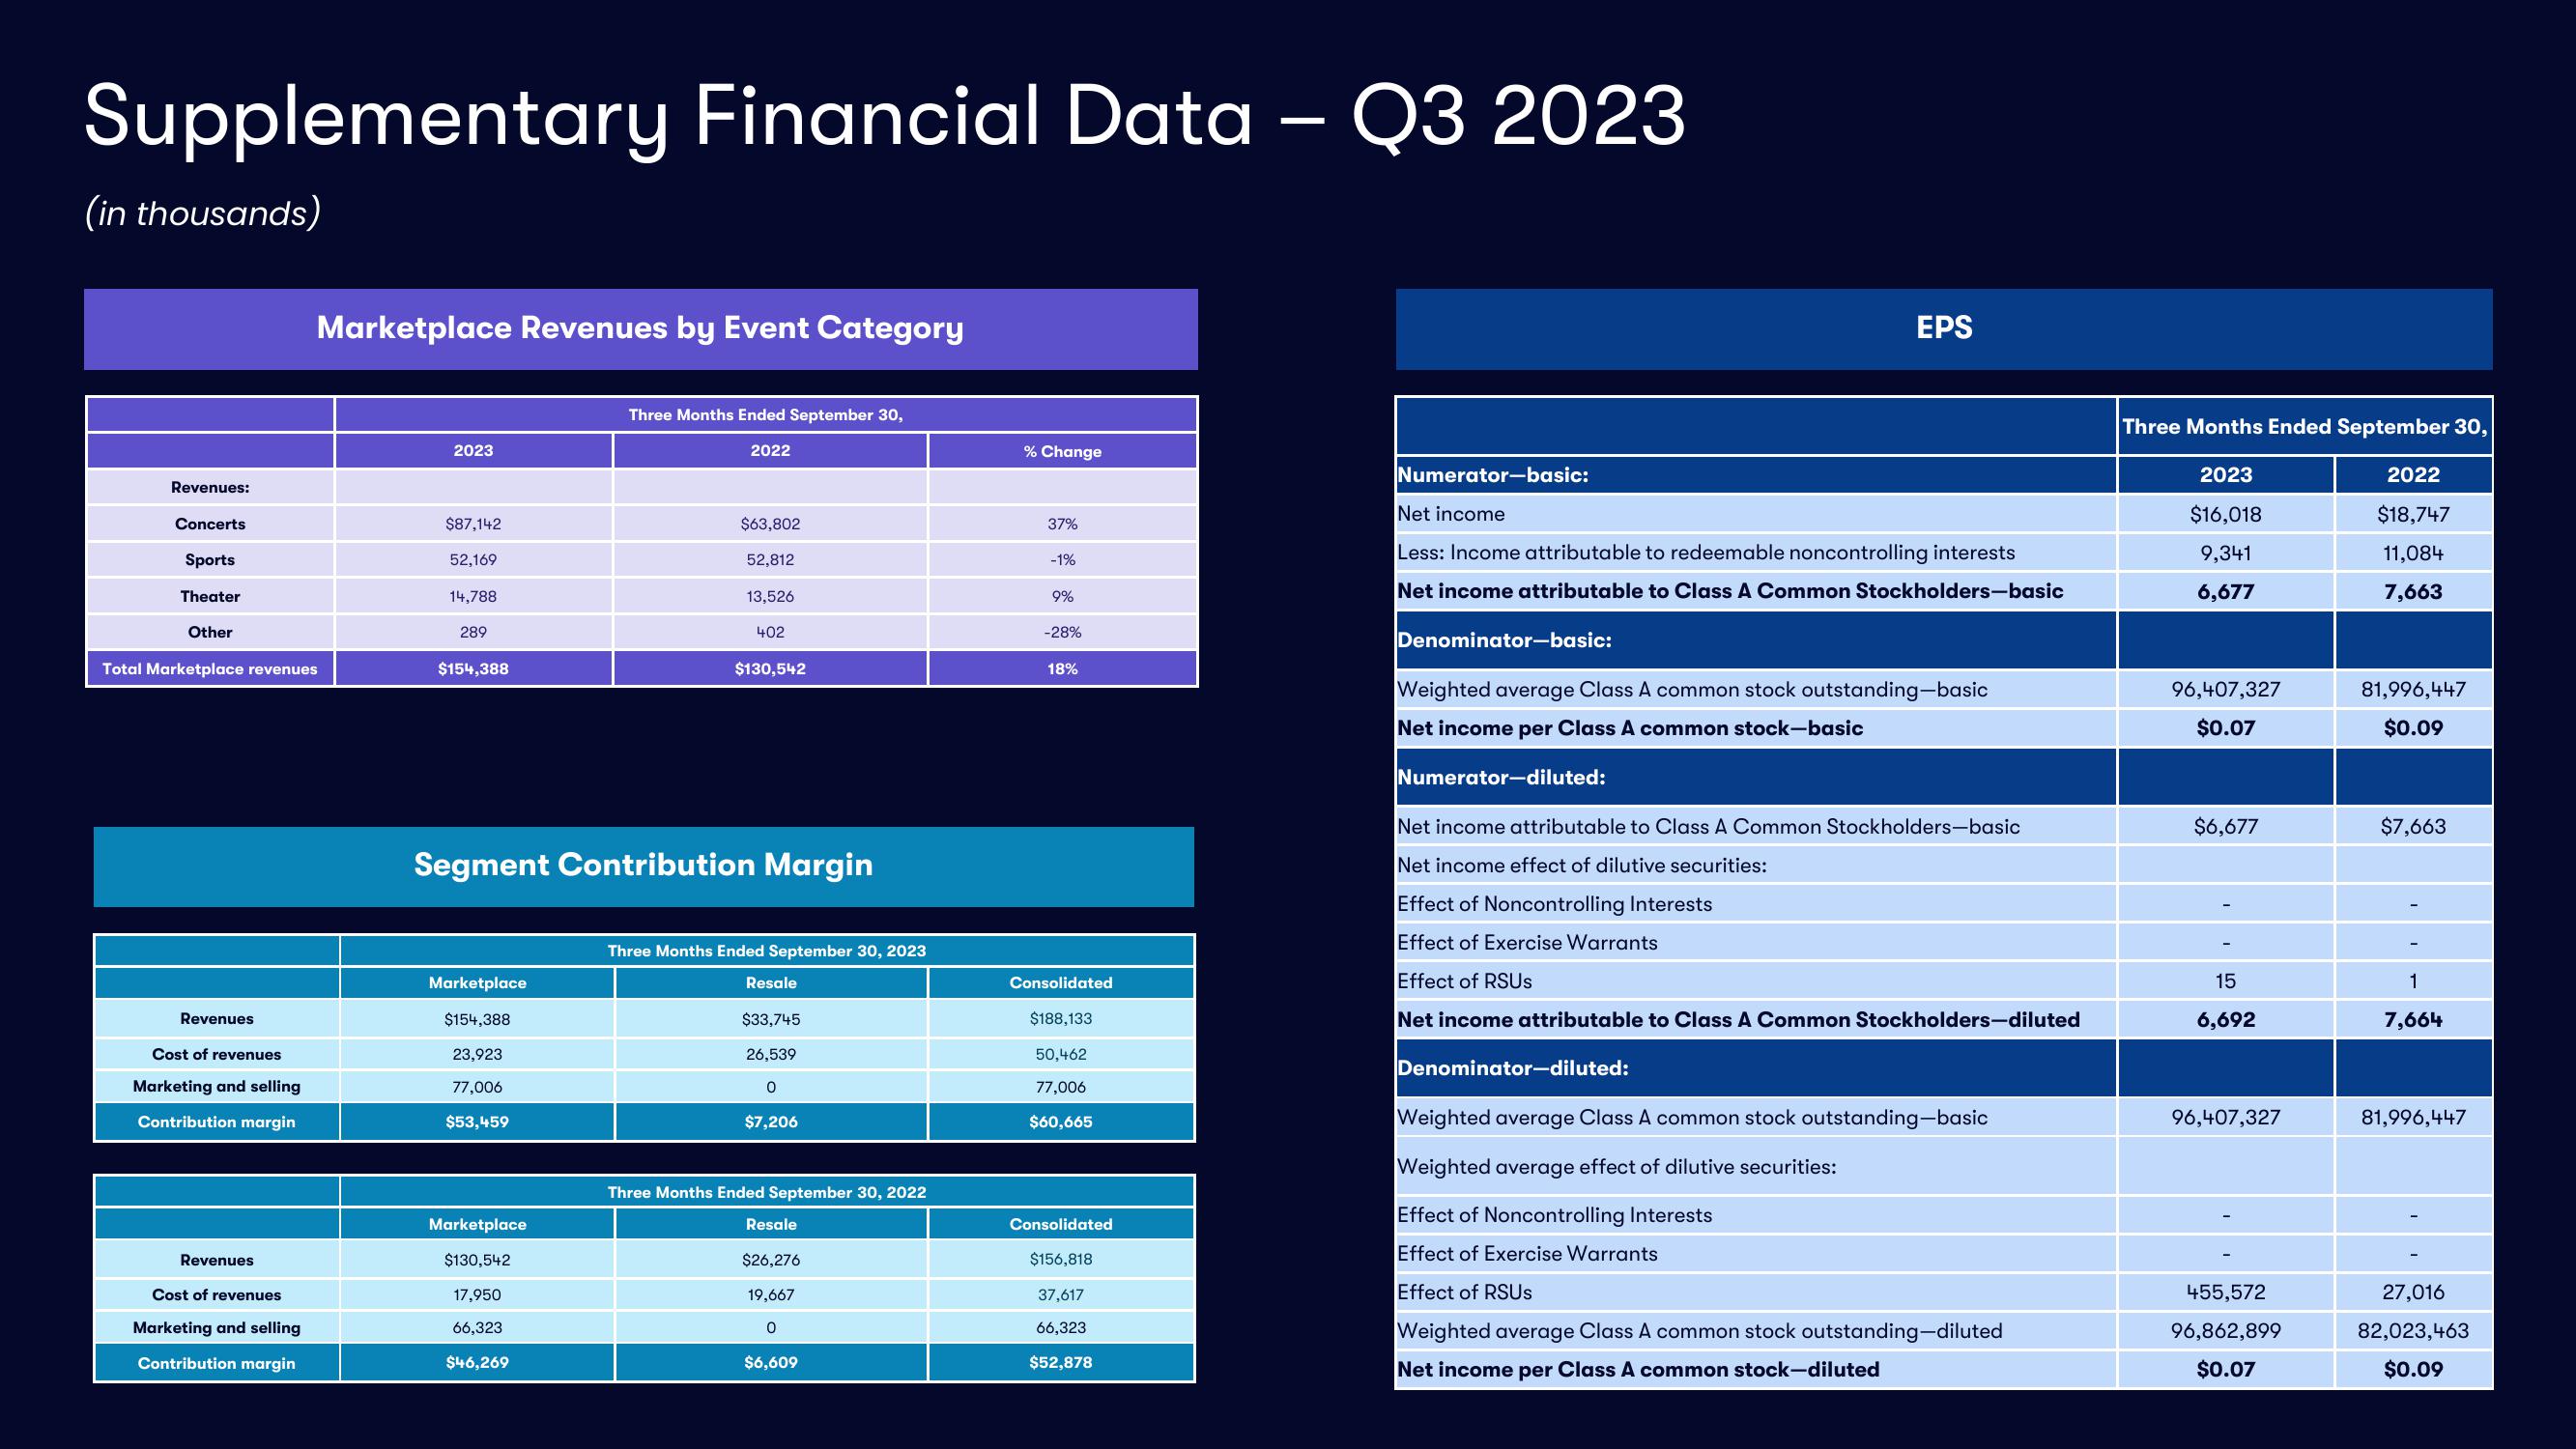
Supplementary Financial Data - Q3 2023
(in thousands)
Revenues:
Concerts
Sports
Theater
Other
Total Marketplace revenues
Revenues
Cost of revenues
Marketing and selling
Contribution margin
Revenues
Marketplace Revenues by Event Category
Cost of revenues
Marketing and selling
Contribution margin
2023
$87,142
52,169
14,788
289
$154,388
Marketplace
$154,388
23,923
77,006
$53,459
Three Months Ended September 30,
Marketplace
$130,542
17,950
66,323
$46,269
2022
$63,802
52,812
13,526
402
Segment Contribution Margin
$130,542
Three Months Ended September 30, 2023
Resale
$33,745
26,539
0
$7,206
Three Months Ended September 30, 2022
Resale
$26,276
19,667
0
$6,609
% Change
37%
-1%
9%
-28%
18%
Consolidated
$188,133
50,462
77,006
$60,665
Consolidated
$156,818
37,617
66,323
$52,878
Numerator-basic:
Net income
Less: Income attributable to redeemable noncontrolling interests
Net income attributable to Class A Common Stockholders-basic
Denominator-basic:
EPS
Weighted average Class A common stock outstanding-basic
Net income per Class A common stock-basic
Numerator-diluted:
Net income attributable to Class A Common Stockholders-basic
Net income effect of dilutive securities:
Effect of Noncontrolling Interests
Effect of Exercise Warrants
Effect of RSUS
Net income attributable to Class A Common Stockholders-diluted
Denominator-diluted:
Weighted average Class A common stock outstanding-basic
Weighted average effect of dilutive securities:
Effect of Noncontrolling Interests
Effect of Exercise Warrants
Effect of RSUS
Weighted average Class A common stock outstanding-diluted
Net income per Class A common stock-diluted
Three Months Ended September 30,
2023
$16,018
9,341
6,677
96,407,327
$0.07
$6,677
15
6,692
96,407,327
455,572
96,862,899
$0.07
2022
$18,747
11,084
7,663
81,996,447
$0.09
$7,663
1
7,664
81,996,447
27,016
82,023,463
$0.09View entire presentation