Comcast Results Presentation Deck
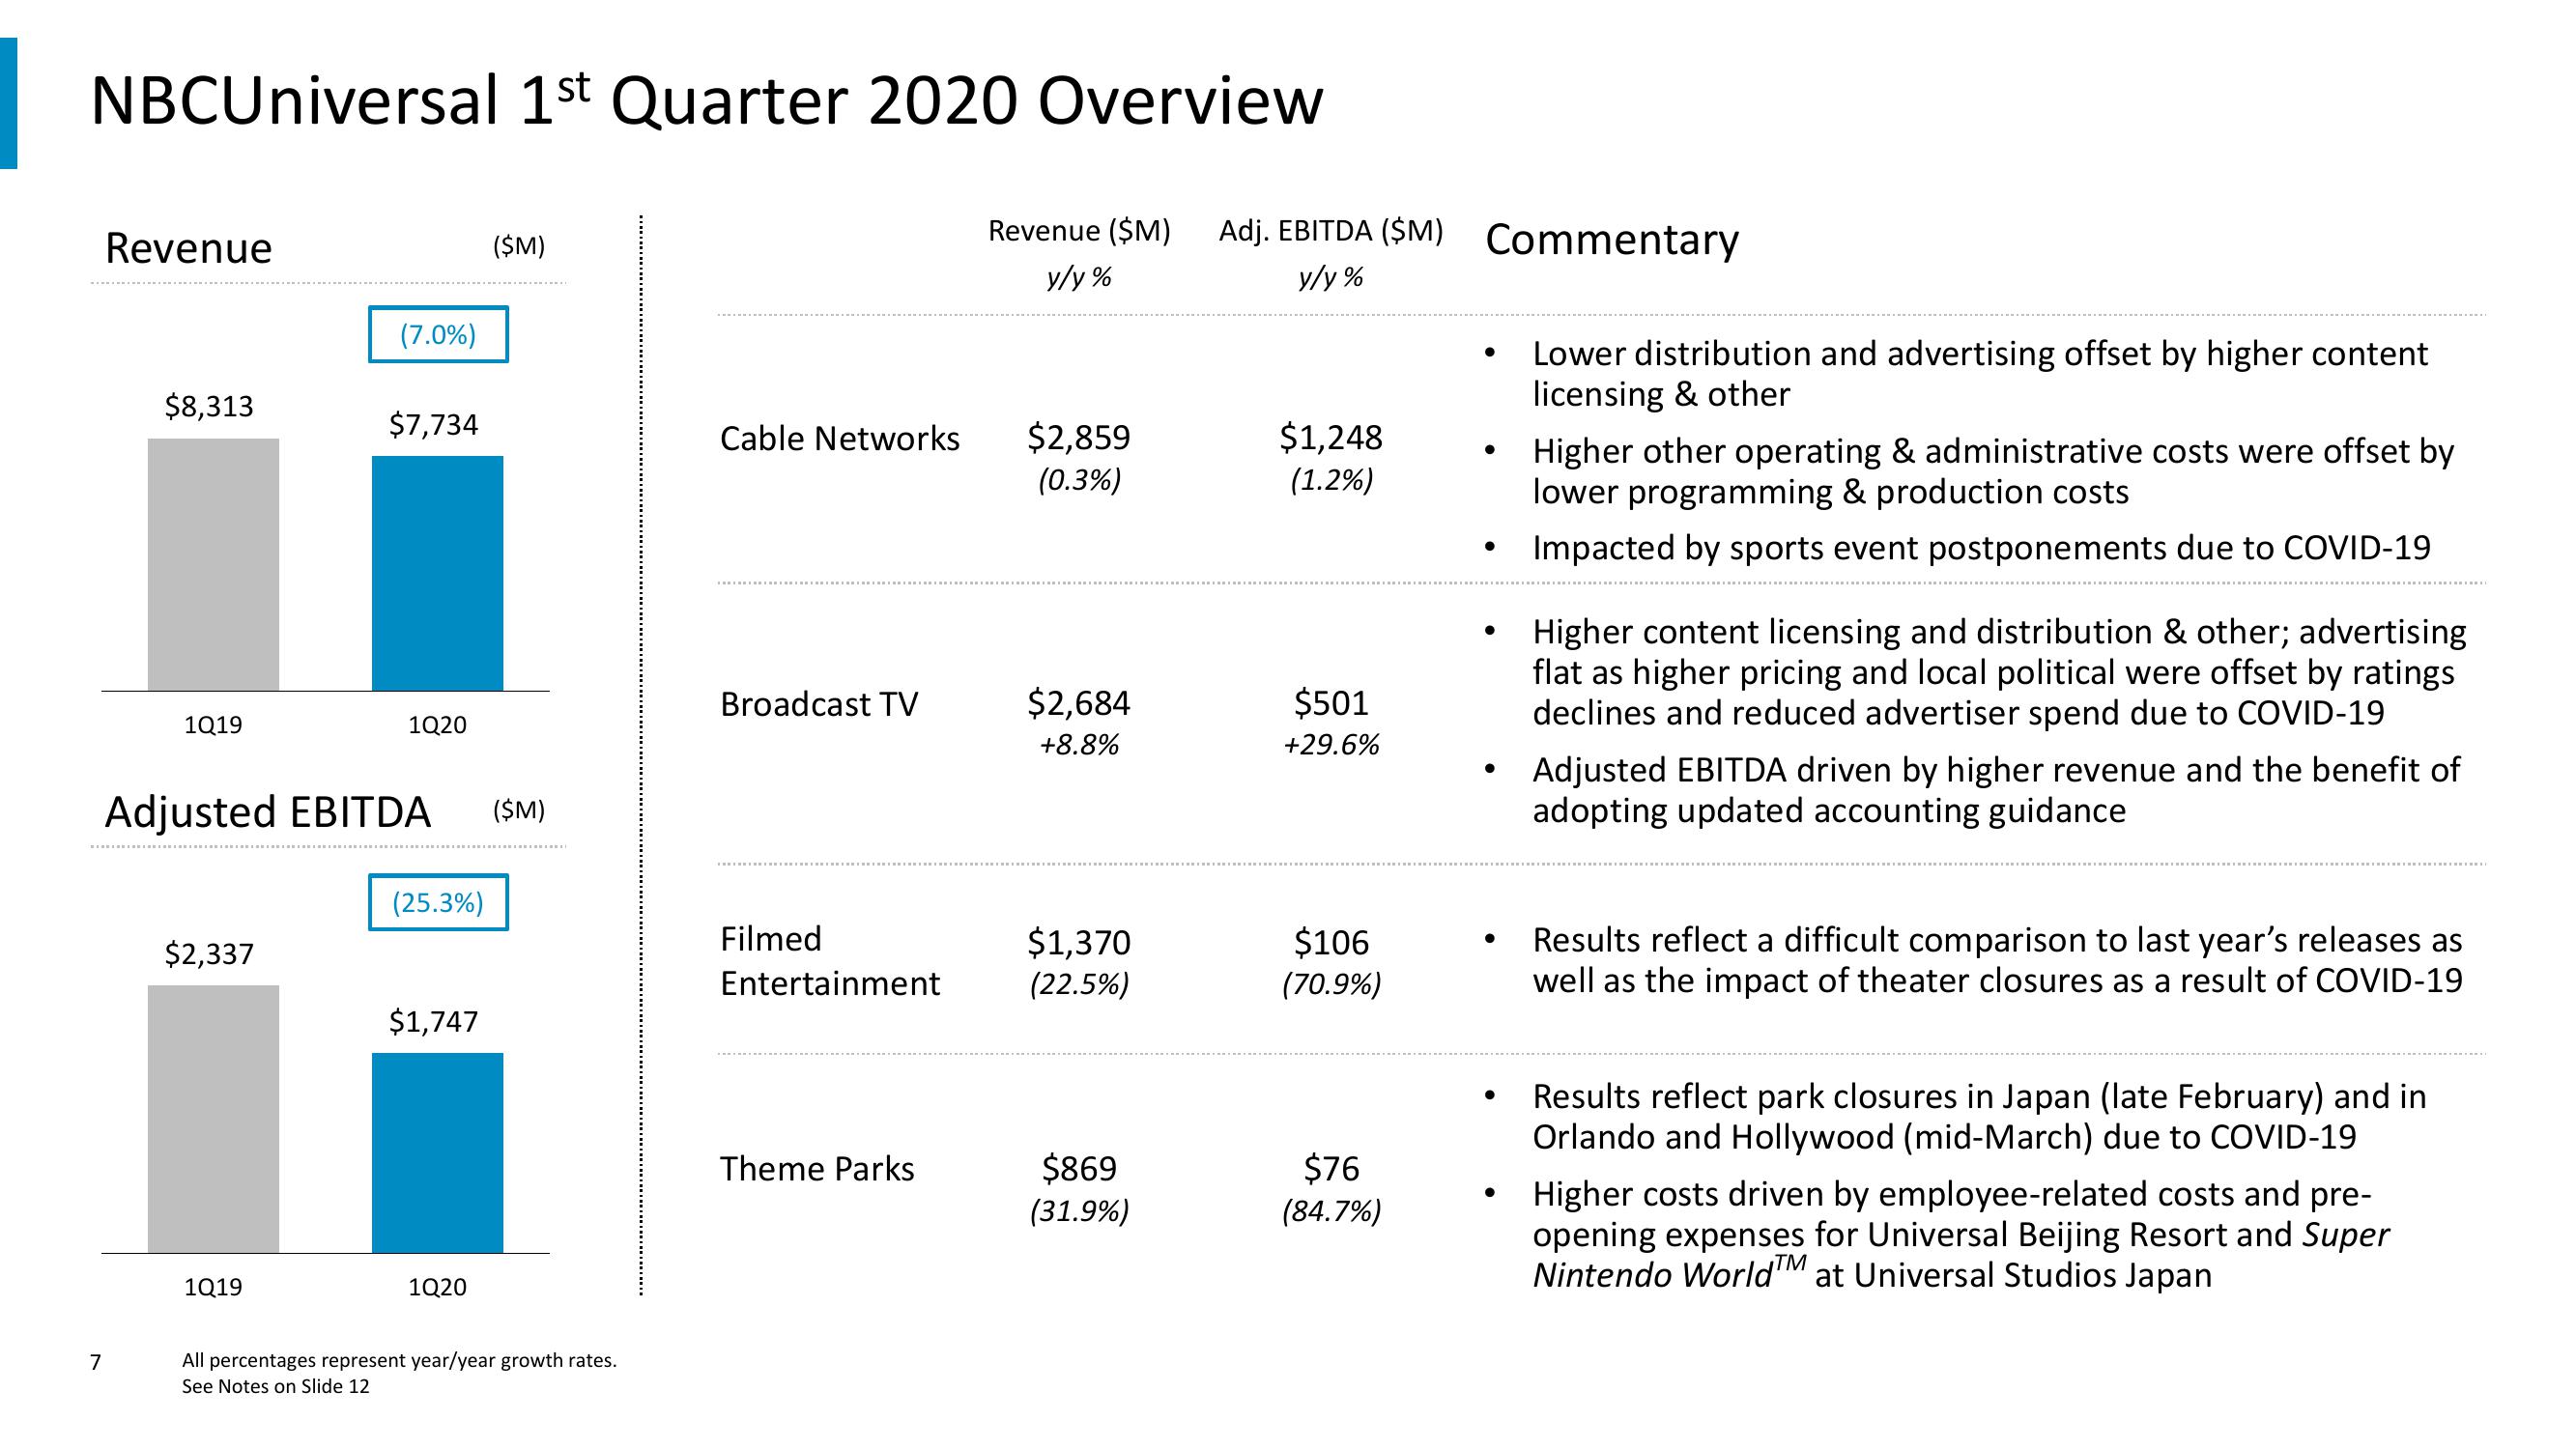
NBCUniversal 1st Quarter 2020 Overview
Revenue ($M)
y/y%
7
Revenue
$8,313
1Q19
$2,337
(7.0%)
1Q19
$7,734
1Q20
Adjusted EBITDA ($M)
(25.3%)
$1,747
($M)
1Q20
All percentages represent year/year growth rates.
See Notes on Slide 12
Cable Networks
Broadcast TV
Filmed
Entertainment
Theme Parks
$2,859
(0.3%)
$2,684
+8.8%
$1,370
(22.5%)
$869
(31.9%)
Adj. EBITDA ($M) Commentary
y/y%
$1,248
(1.2%)
$501
+29.6%
$106
(70.9%)
$76
(84.7%)
●
●
●
●
Lower distribution and advertising offset by higher content
licensing & other
Higher other operating & administrative costs were offset by
lower programming & production costs
Impacted by sports event postponements due to COVID-19
Higher content licensing and distribution & other; advertising
flat as higher pricing and local political were offset by ratings
declines and reduced advertiser spend due to COVID-19
Adjusted EBITDA driven by higher revenue and the benefit of
adopting updated accounting guidance
Results reflect a difficult comparison to last year's releases as
well as the impact of theater closures as a result of COVID-19
Results reflect park closures in Japan (late February) and in
Orlando and Hollywood (mid-March) due to COVID-19
Higher costs driven by employee-related costs and pre-
opening expenses for Universal Beijing Resort and Super
Nintendo WorldTM at Universal Studios JapanView entire presentation