Owens&Minor Investor Day Presentation Deck
90
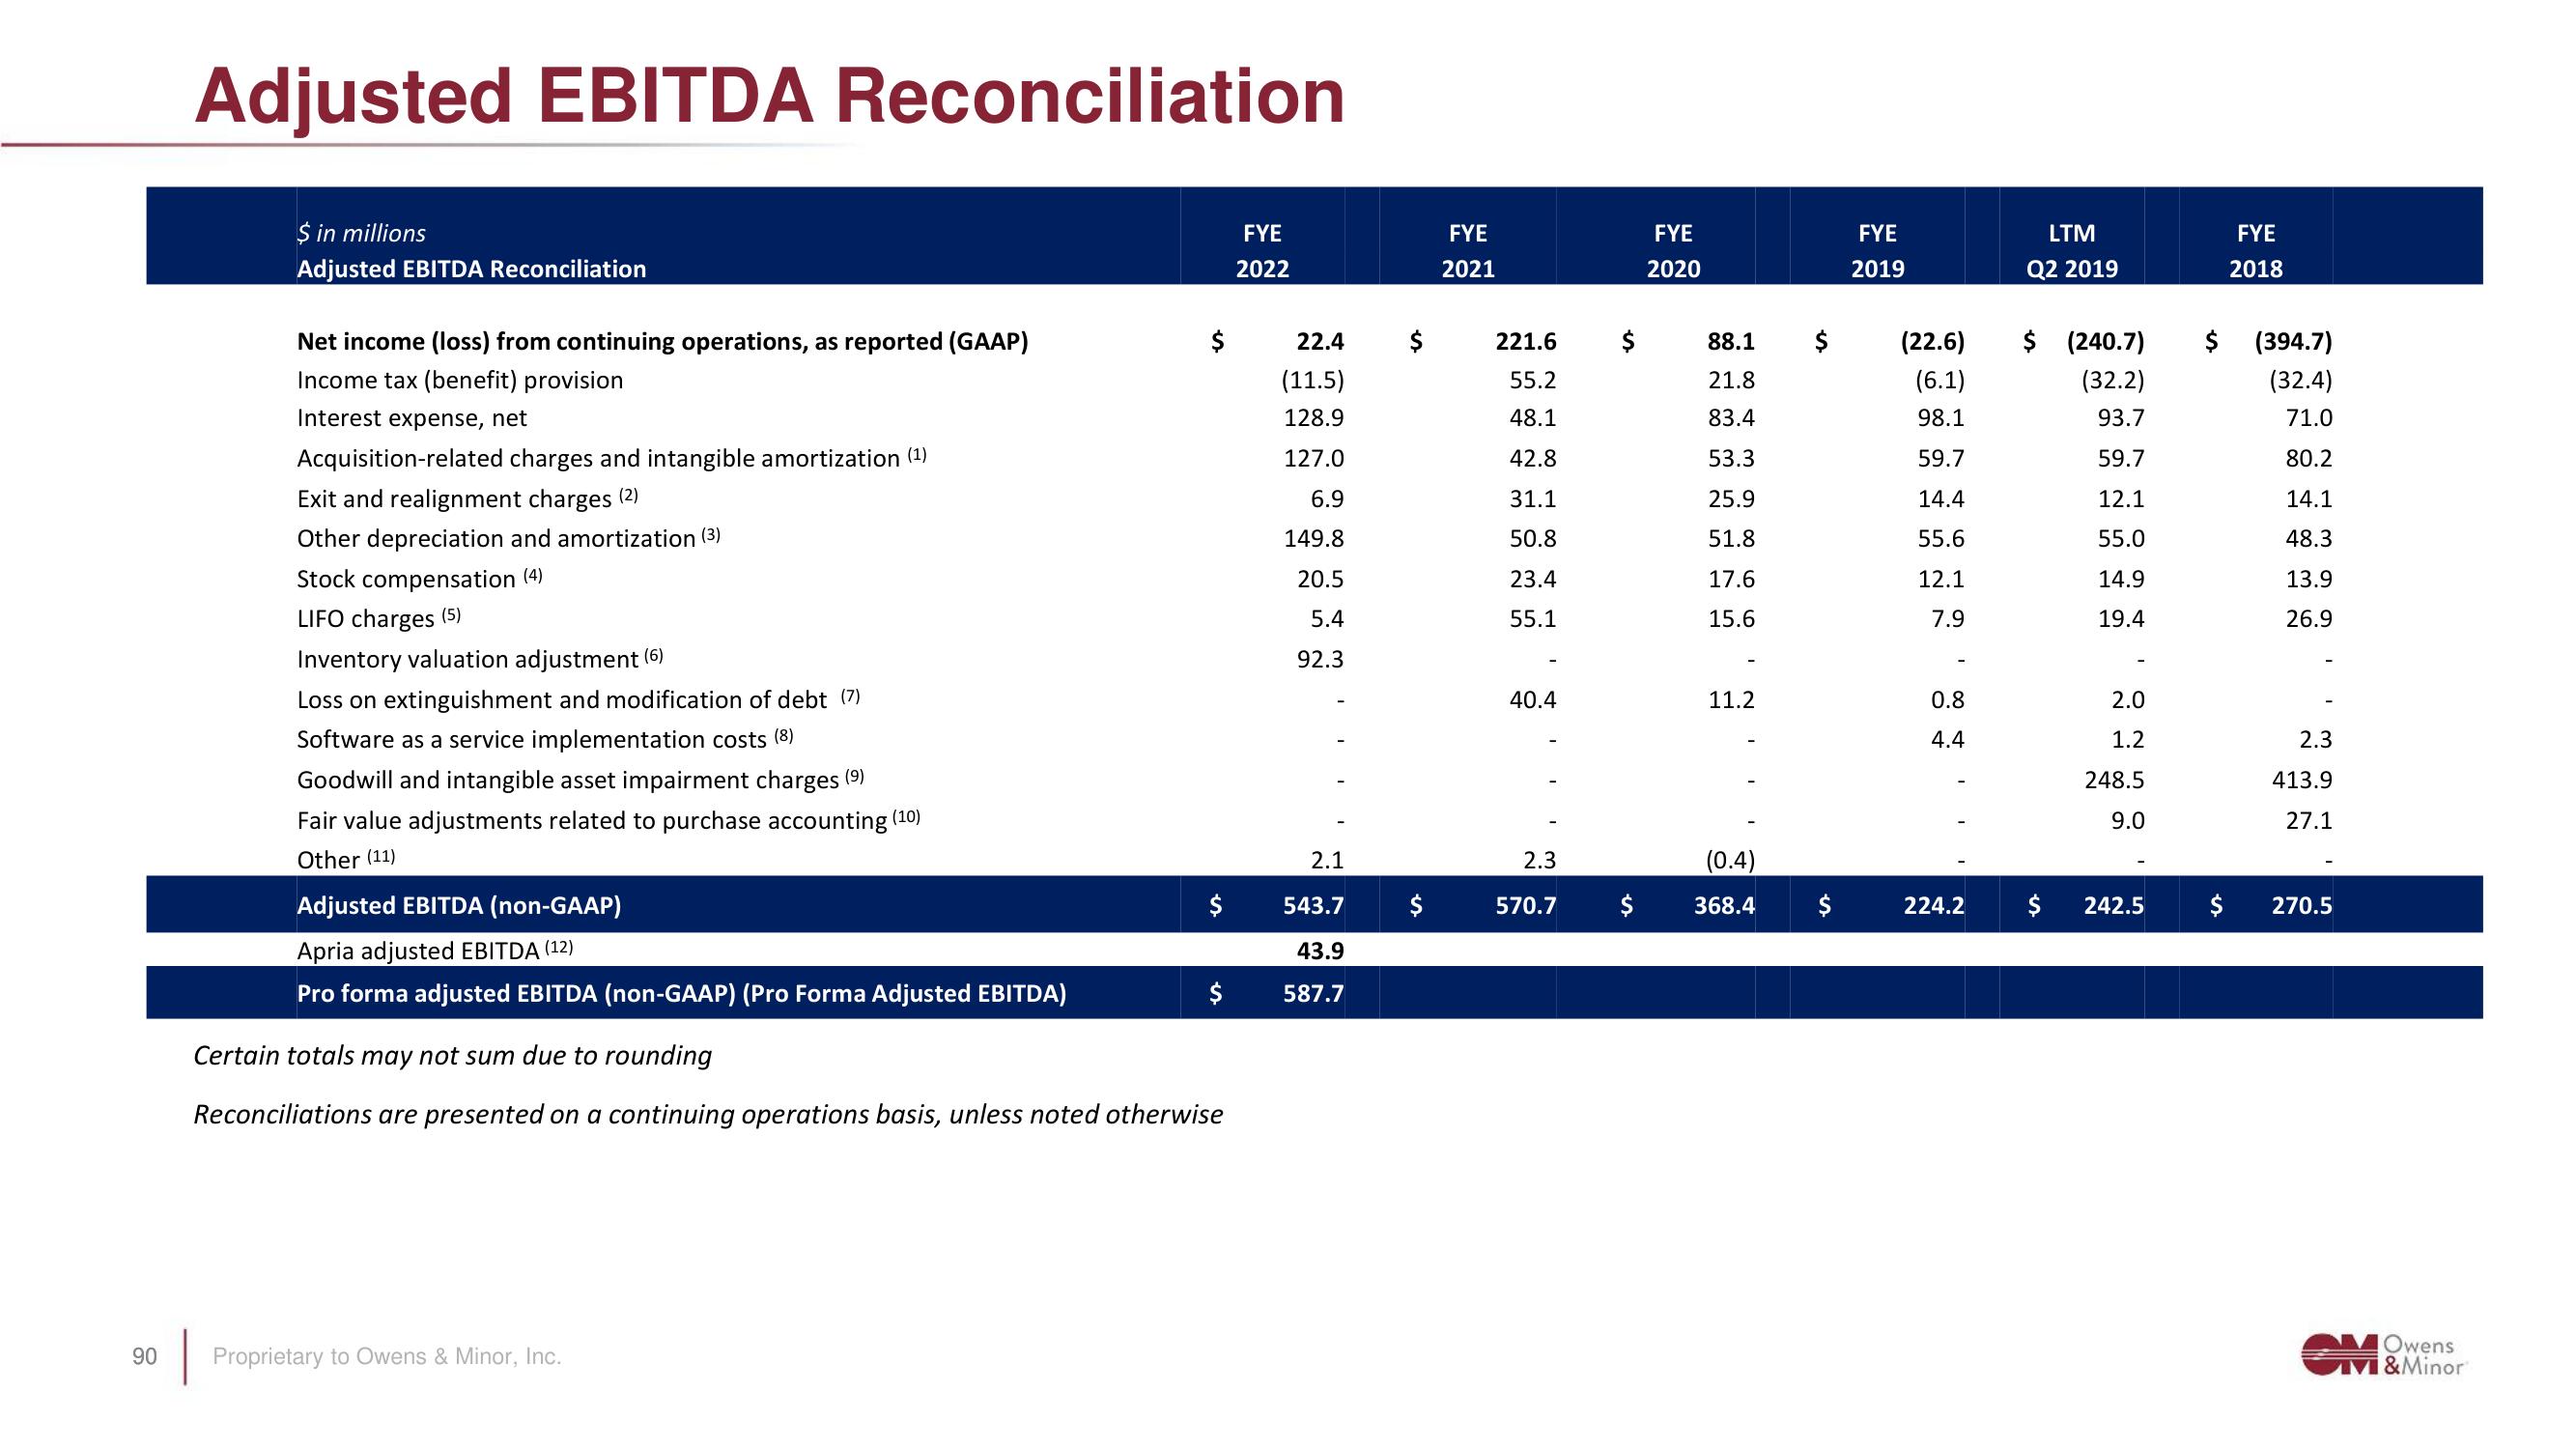
Adjusted EBITDA Reconciliation
$ in millions
Adjusted EBITDA Reconciliation
Net income (loss) from continuing operations, as reported (GAAP)
Income tax (benefit) provision
Interest expense, net
Acquisition-related charges and intangible amortization (¹)
Exit and realignment charges (2)
Other depreciation and amortization (3)
Stock compensation (4)
LIFO charges (5)
Inventory valuation adjustment (6)
Loss on extinguishment and modification of debt (7)
Software as a service implementation costs (8)
Goodwill and intangible asset impairment charges (9)
Fair value adjustments related to purchase accounting (10)
Other (11)
Adjusted EBITDA (non-GAAP)
Apria adjusted EBITDA (12)
Pro forma adjusted EBITDA (non-GAAP) (Pro Forma Adjusted EBITDA)
$
Proprietary to Owens & Minor, Inc.
$
Certain totals may not sum due to rounding
Reconciliations are presented on a continuing operations basis, unless noted otherwise
FYE
2022
22.4
(11.5)
128.9
127.0
6.9
149.8
20.5
5.4
92.3
2.1
543.7
43.9
587.7
FYE
2021
221.6
55.2
48.1
42.8
31.1
50.8
23.4
55.1
40.4
2.3
570.7
FYE
2020
88.1
21.8
83.4
53.3
25.9
51.8
17.6
15.6
11.2
(0.4)
368.4
FYE
2019
(22.6)
(6.1)
98.1
59.7
14.4
55.6
12.1
7.9
0.8
4.4
224.2
LTM
Q2 2019
$ (240.7)
(32.2)
93.7
59.7
12.1
55.0
14.9
19.4
2.0
1.2
248.5
9.0
242.5
FYE
2018
(394.7)
(32.4)
71.0
80.2
14.1
48.3
13.9
26.9
2.3
413.9
27.1
270.5
MOwens
M&MinorView entire presentation