J.P.Morgan 2Q23 Investor Results
JPMORGAN CHASE & CO.
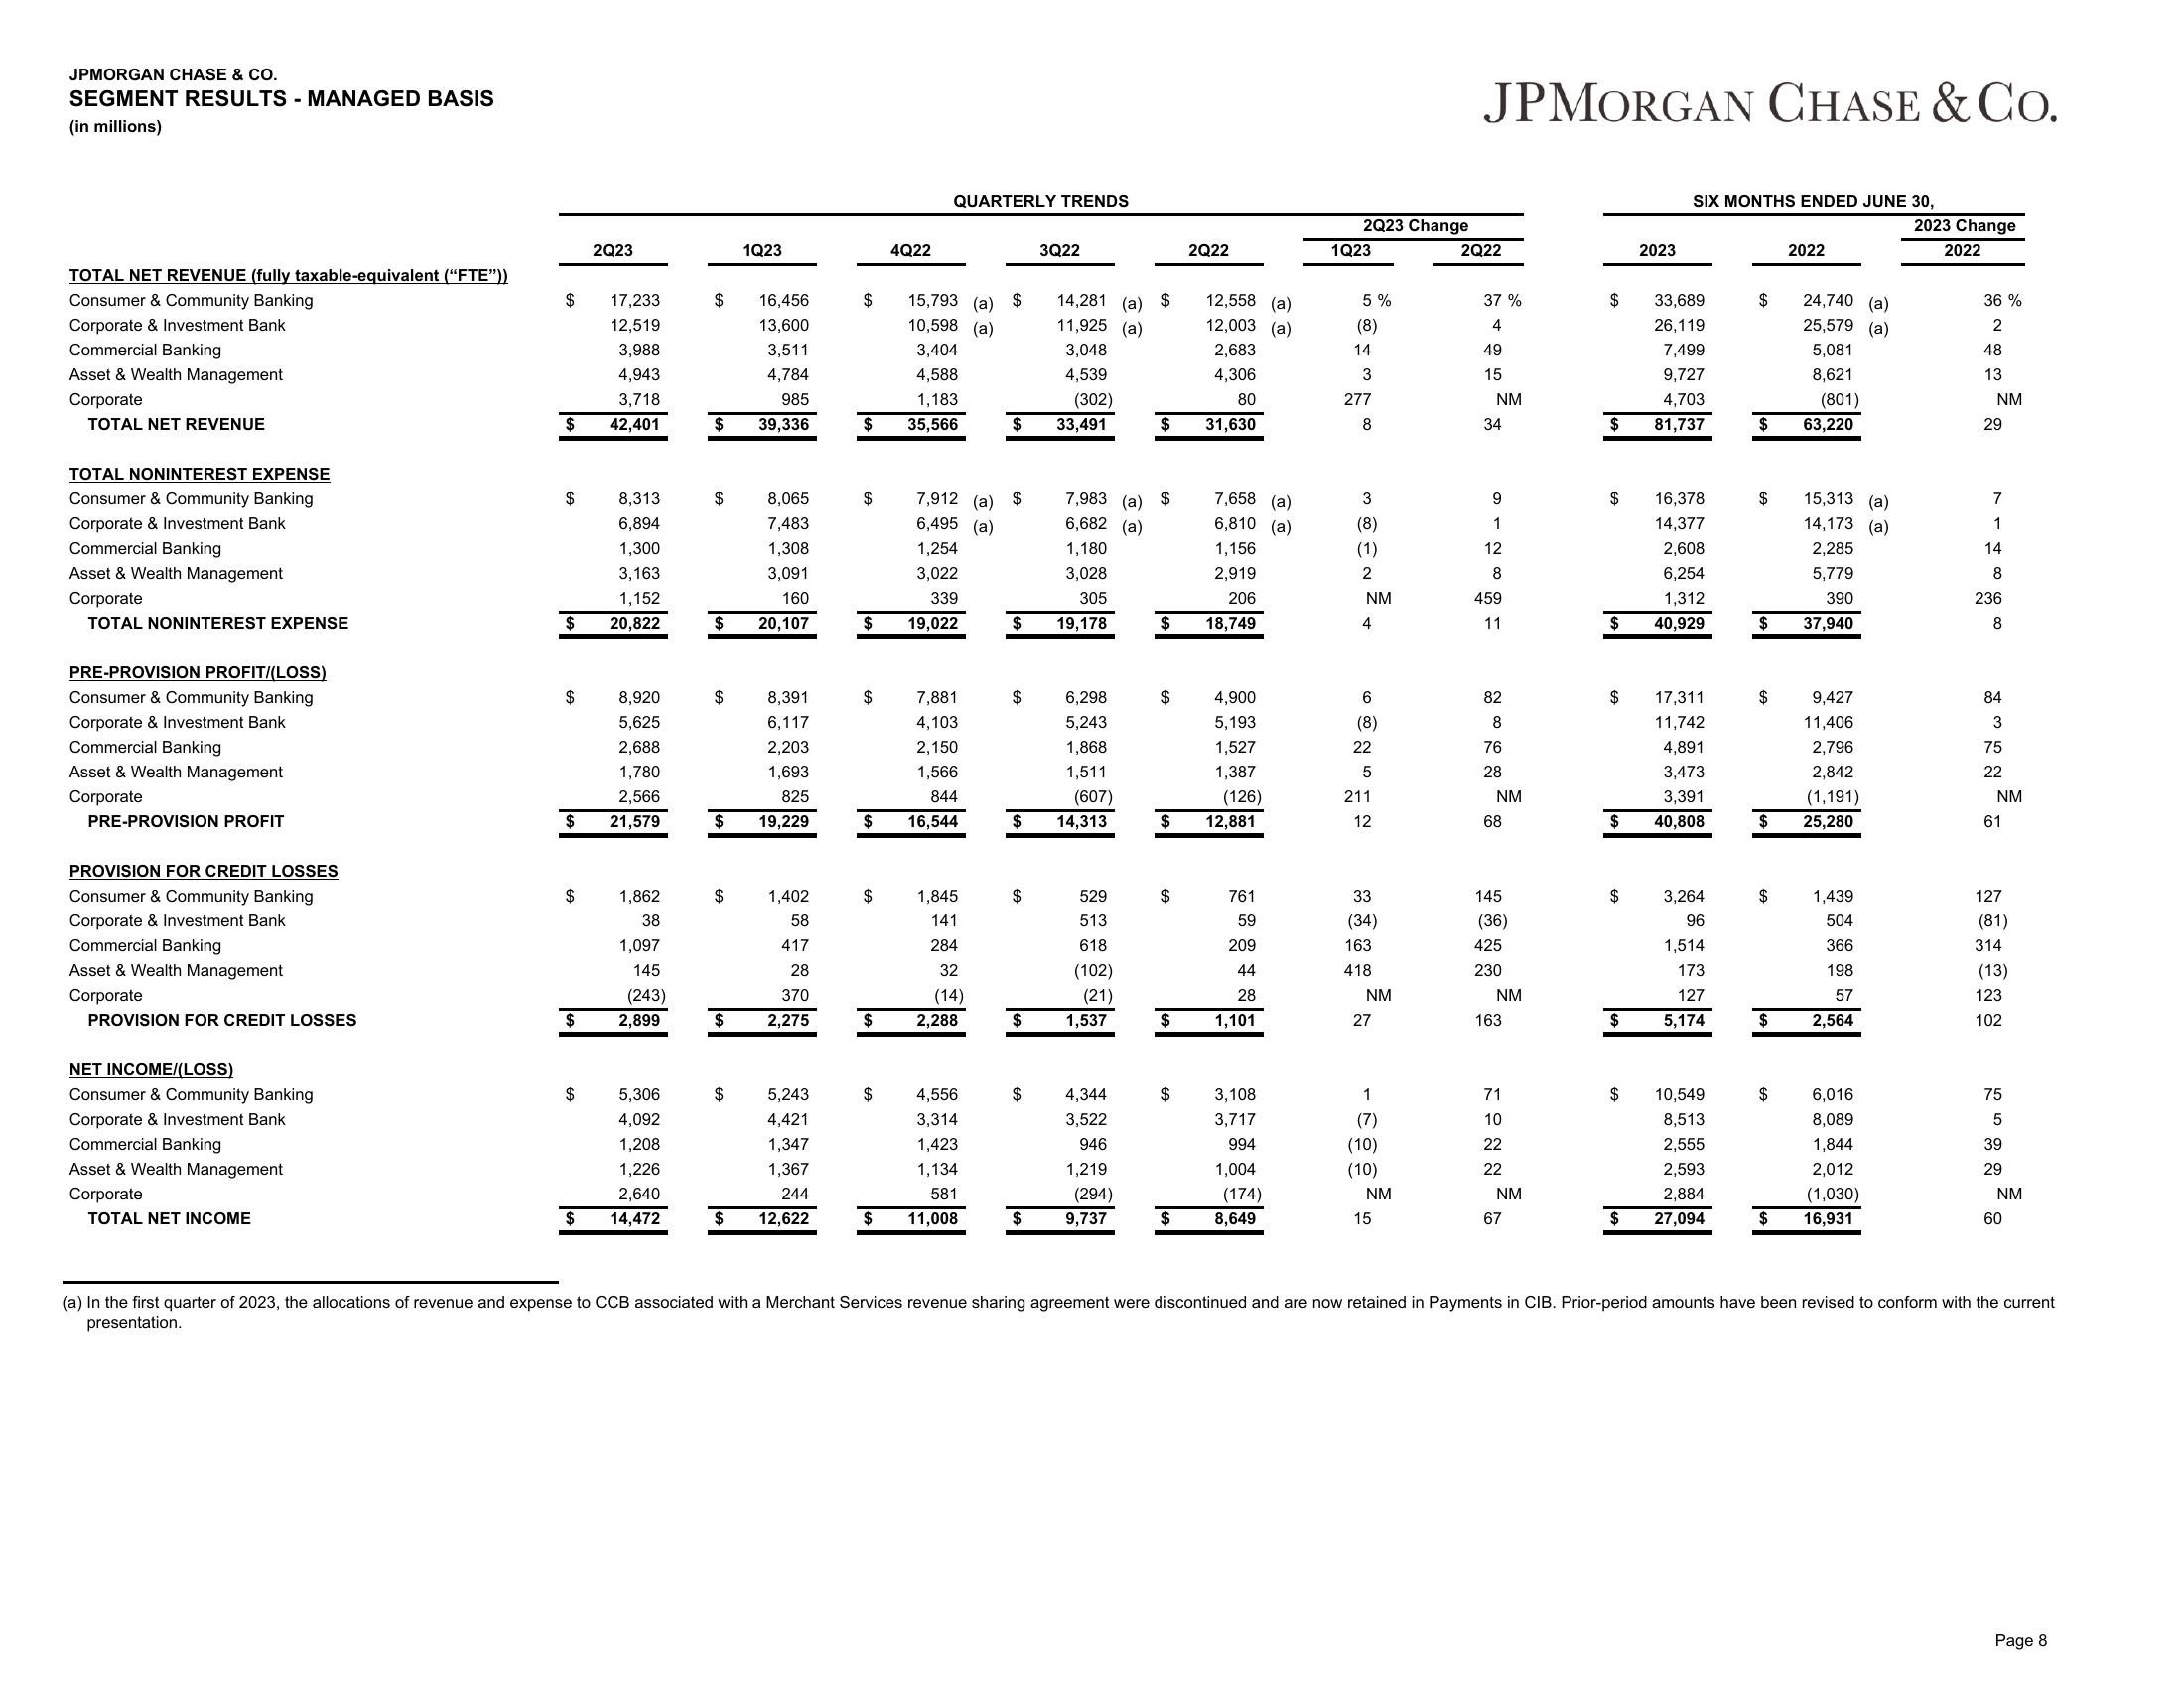
SEGMENT RESULTS - MANAGED BASIS
(in millions)
TOTAL NET REVENUE (fully taxable-equivalent ("FTE"))
Consumer & Community Banking
Corporate & Investment Bank
Commercial Banking
Asset & Wealth Management
Corporate
TOTAL NET REVENUE
TOTAL NONINTEREST EXPENSE
Consumer & Community Banking
Corporate & Investment Bank
Commercial Banking
Asset & Wealth Management
Corporate
TOTAL NONINTEREST EXPENSE
PRE-PROVISION PROFIT/(LOSS)
Consumer & Community Banking
Corporate & Investment Bank
Commercial Banking
Asset & Wealth Management
Corporate
PRE-PROVISION PROFIT
PROVISION FOR CREDIT LOSSES
Consumer & Community Banking
Corporate & Investment Bank
Commercial Banking
Asset & Wealth Management
Corporate
PROVISION FOR CREDIT LOSSES
NET INCOME/(LOSS)
Consumer & Community Banking
Corporate & Investment Bank
Commercial Banking
Asset & Wealth Management
Corporate
TOTAL NET INCOME
$
$
$
$
$
$
8,920
5,625
2,688
1,780
2,566
$ 21,579
$
$
2Q23
$
17,233
12,519
3,988
4,943
3,718
42,401
8,313
6,894
1,300
3,163
1,152
20,822
1,862
38
1,097
145
(243)
2,899
5,306
4,092
1,208
1,226
2,640
14,472
$
$
$
8,065
7,483
1,308
3,091
160
$ 20,107
$
1Q23
8,391
6,117
2,203
1,693
825
$ 19,229
$
16,456
13,600
3,511
4,784
985
39,336
$
1,402
58
417
28
370
2,275
5,243
4,421
1,347
1,367
244
$ 12,622
15,793 (a)
10,598 (a)
3,404
4,588
1,183
$ 35,566
$
$
4Q22
QUARTERLY TRENDS
7,912 (a) $
6,495 (a)
1,254
3,022
339
$ 19,022
$
7,881
4,103
2,150
1,566
844
$ 16,544
$
1,845
141
284
32
(14)
2,288
$
4,556
3,314
1,423
1,134
581
$ 11,008
$
$
$
$
$
3Q22
(607)
$ 14,313
$
14,281 (a)
11,925 (a)
3,048
4,539
(302)
33,491
7,983 (a)
6,682 (a)
1,180
3,028
305
19,178
6,298
5,243
1,868
1,511
529
513
618
(102)
(21)
1,537
4,344
3,522
946
1,219
(294)
9,737
$
$
$
$
$
$
$
$
$
$
2Q22
12,558 (a)
12,003 (a)
2,683
4,306
80
31,630
7,658 (a)
6,810 (a)
1,156
2,919
206
18,749
4,900
5,193
1,527
1,387
(126)
12,881
761
59
209
44
28
1,101
3,108
3,717
994
1,004
(174)
8,649
2Q23 Change
1Q23
5%
(8)
14
3
277
8
3
(8)
(1)
2
NM
4
6
(8)
22
5
211
12
33
(34)
163
418
NM
27
1
(7)
(10)
(10)
NM
15
JPMORGAN CHASE & Co.
2Q22
37 %
4
49
15
NM
34
9
1
12
8
459
11
82
8
76
28
NM
68
145
(36)
425
230
NM
163
71
10
22
22
NM
67
$
$
$
$
$
$
$
$
$
$
2023
SIX MONTHS ENDED JUNE 30,
33,689
26,119
7,499
9,727
4,703
81,737
16,378
14,377
2,608
6,254
1,312
40,929
17,311
11,742
4,891
3,473
3,391
40,808
3,264
96
1,514
173
127
5,174
10,549
8,513
2,555
2,593
2,884
27,094
$
$
$
$
$
$
$
$
$
2022
24,740 (a)
25,579 (a)
5,081
8,621
(801)
63,220
15,313 (a)
14,173 (a)
2,285
5,779
390
37,940
9,427
11,406
2,796
2,842
(1,191)
25,280
1,439
504
366
198
57
2,564
6,016
8,089
1,844
2,012
(1,030)
16,931
2023 Change
2022
36 %
2
48
13
NM
29
7
1
14
8
236
8
84
3
75
22
NM
61
127
(81)
314
(13)
123
102
75
5
39
29
NM
60
(a) In the first quarter of 2023, the allocations of revenue and expense to CCB associated with a Merchant Services revenue sharing agreement were discontinued and are now retained in Payments in CIB. Prior-period amounts have been revised to conform with the current
presentation.
Page 8View entire presentation