Spotify Results Presentation Deck
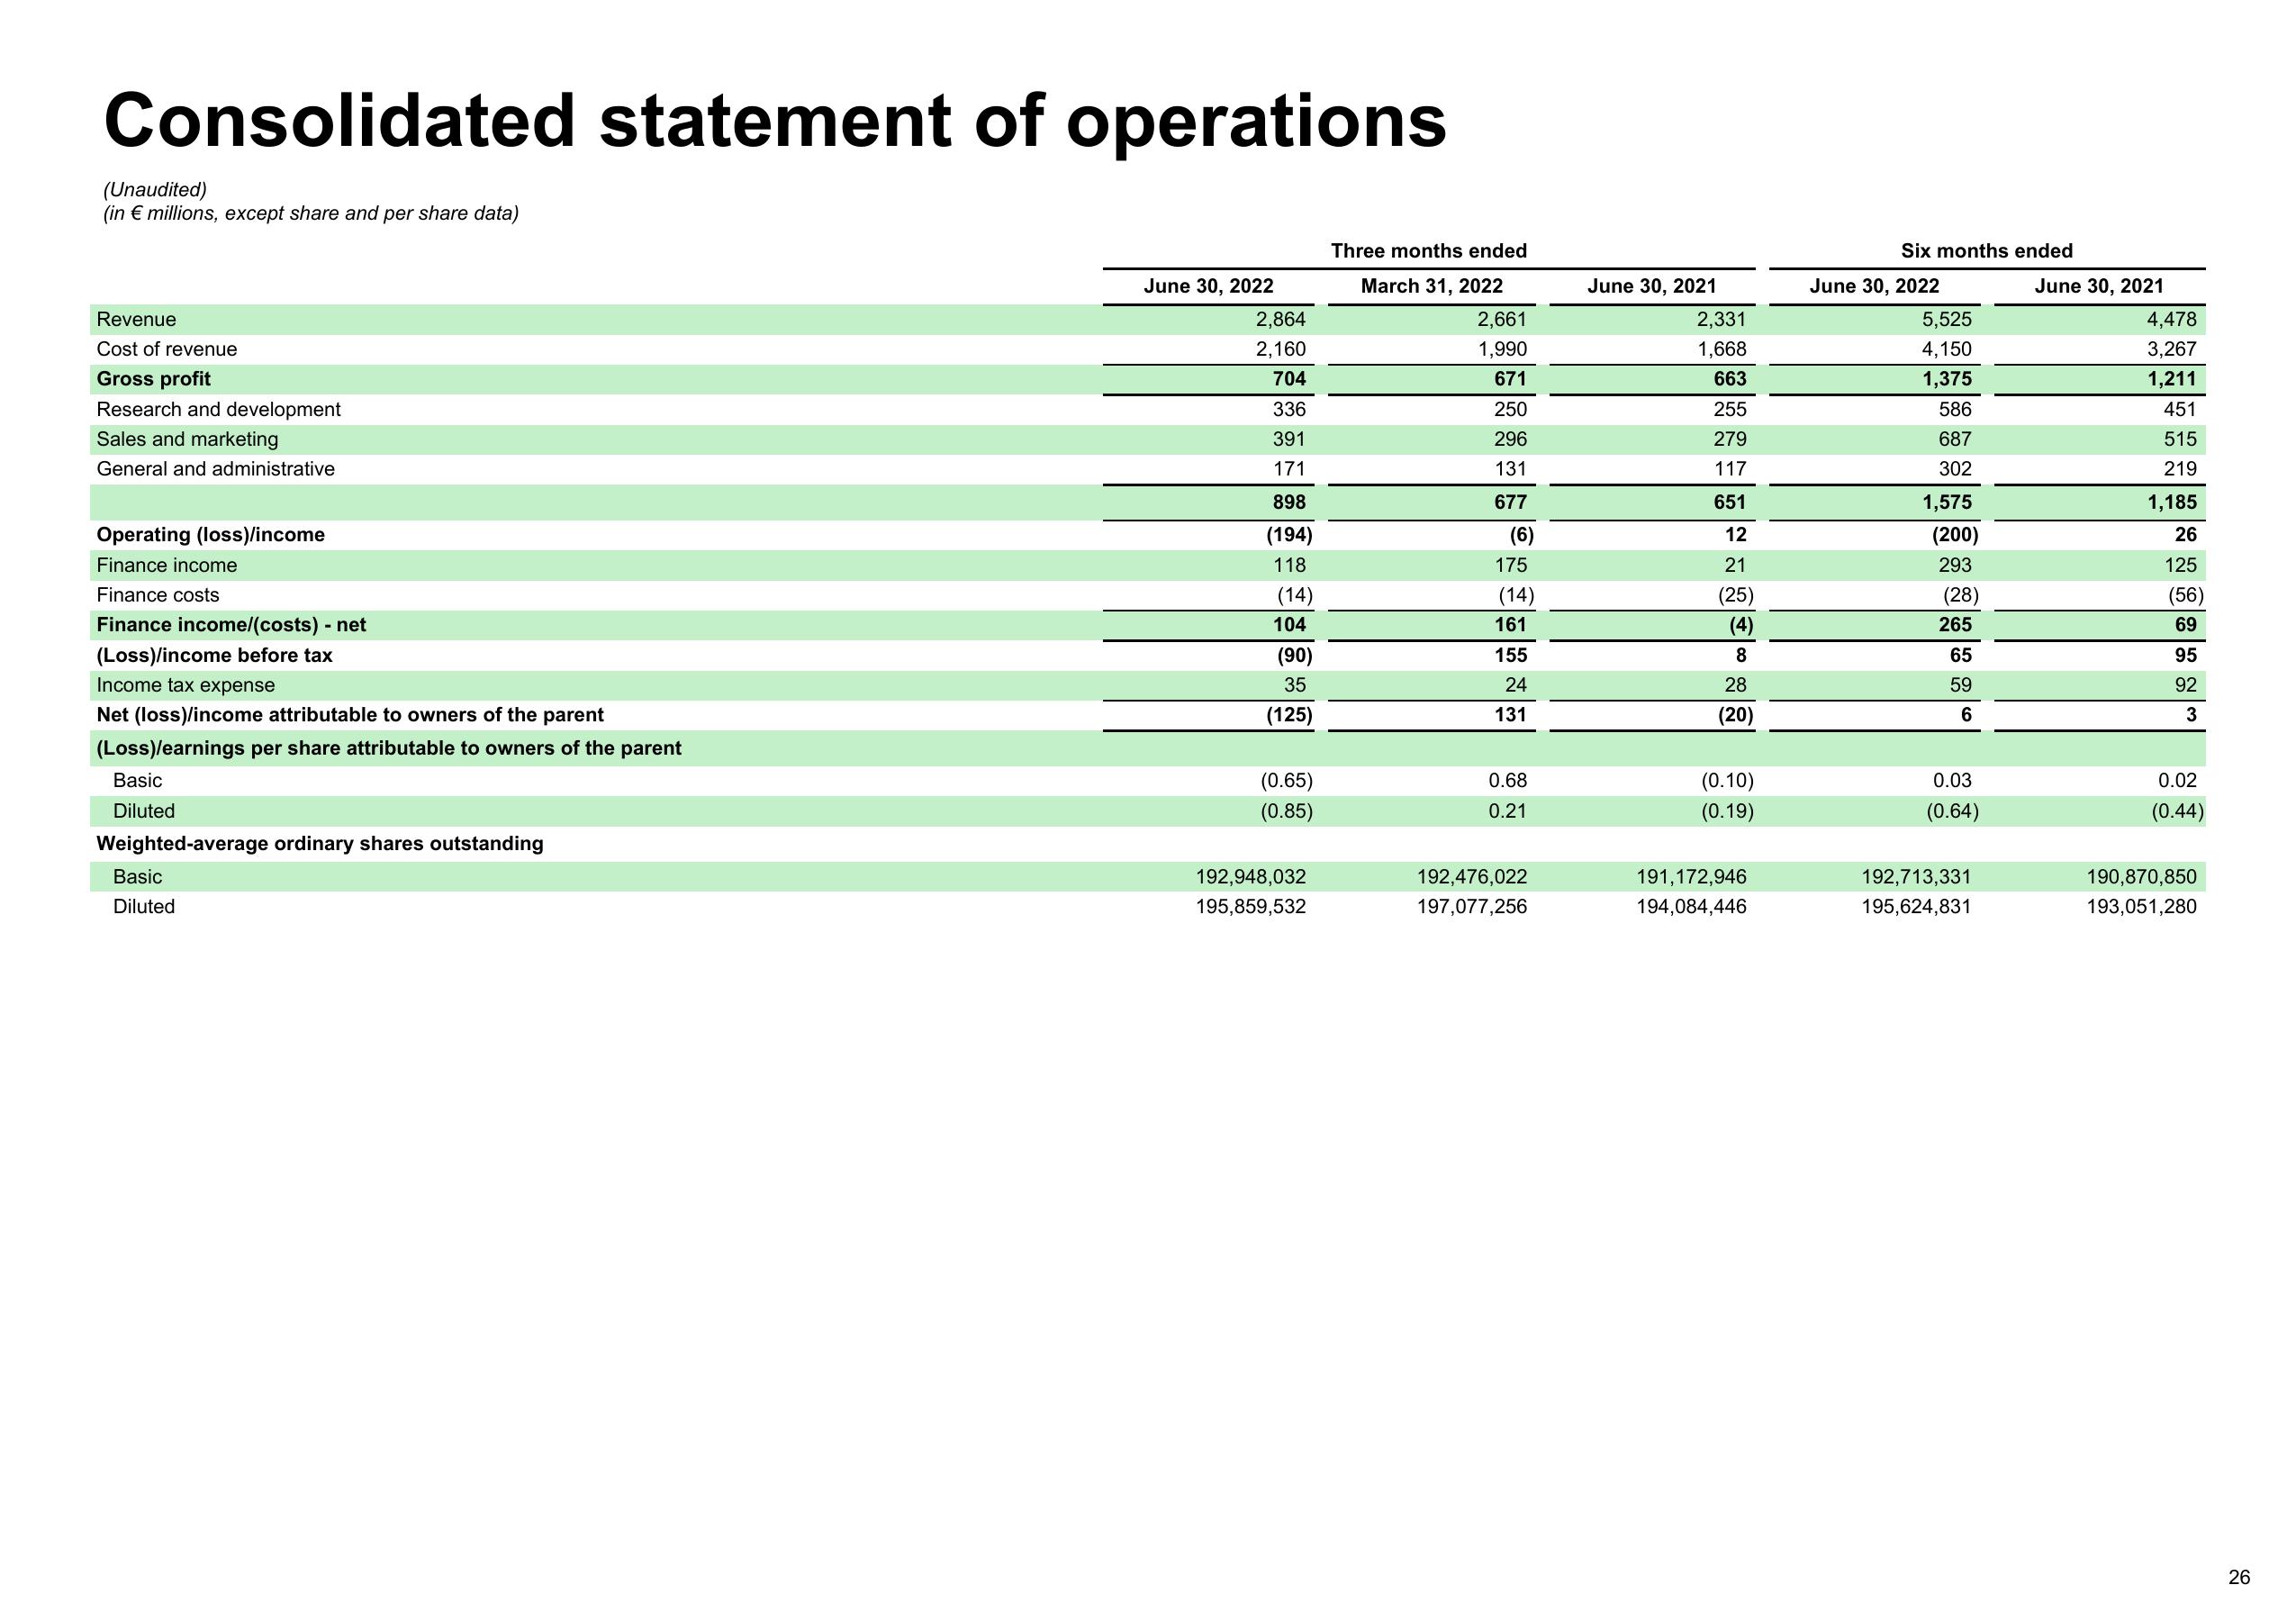
Consolidated statement of operations
(Unaudited)
(in € millions, except share and per share data)
Revenue
Cost of revenue
Gross profit
Research and development
Sales and marketing
General and administrative
Operating (loss)/income
Finance income
Finance costs
Finance income/(costs) - net
(Loss)/income before tax
Income tax expense
Net (loss)/income attributable to owners of the parent
(Loss)/earnings per share attributable to owners of the parent
Basic
Diluted
Weighted-average ordinary shares outstanding
Basic
Diluted
June 30, 2022
2,864
2,160
704
336
391
171
898
(194)
118
(14)
104
(90)
35
(125)
(0.65)
(0.85)
192,948,032
195,859,532
Three months ended
March 31, 2022
2,661
1,990
671
250
296
131
677
(6)
175
(14)
161
155
24
131
0.68
0.21
192,476,022
197,077,256
June 30, 2021
2,331
1,668
663
255
279
117
651
12
21
(25)
(4)
8
28
(20)
(0.10)
(0.19)
191,172,946
194,084,446
Six months ended
June 30, 2022
5,525
4,150
1,375
586
687
302
1,575
(200)
293
(28)
265
65
59
6
0.03
(0.64)
192,713,331
195,624,831
June 30, 2021
4,478
3,267
1,211
451
515
219
1,185
26
125
(56)
69
95
92
3
0.02
(0.44)
190,870,850
193,051,280
26View entire presentation