Morgan Stanley Investment Banking Pitch Book
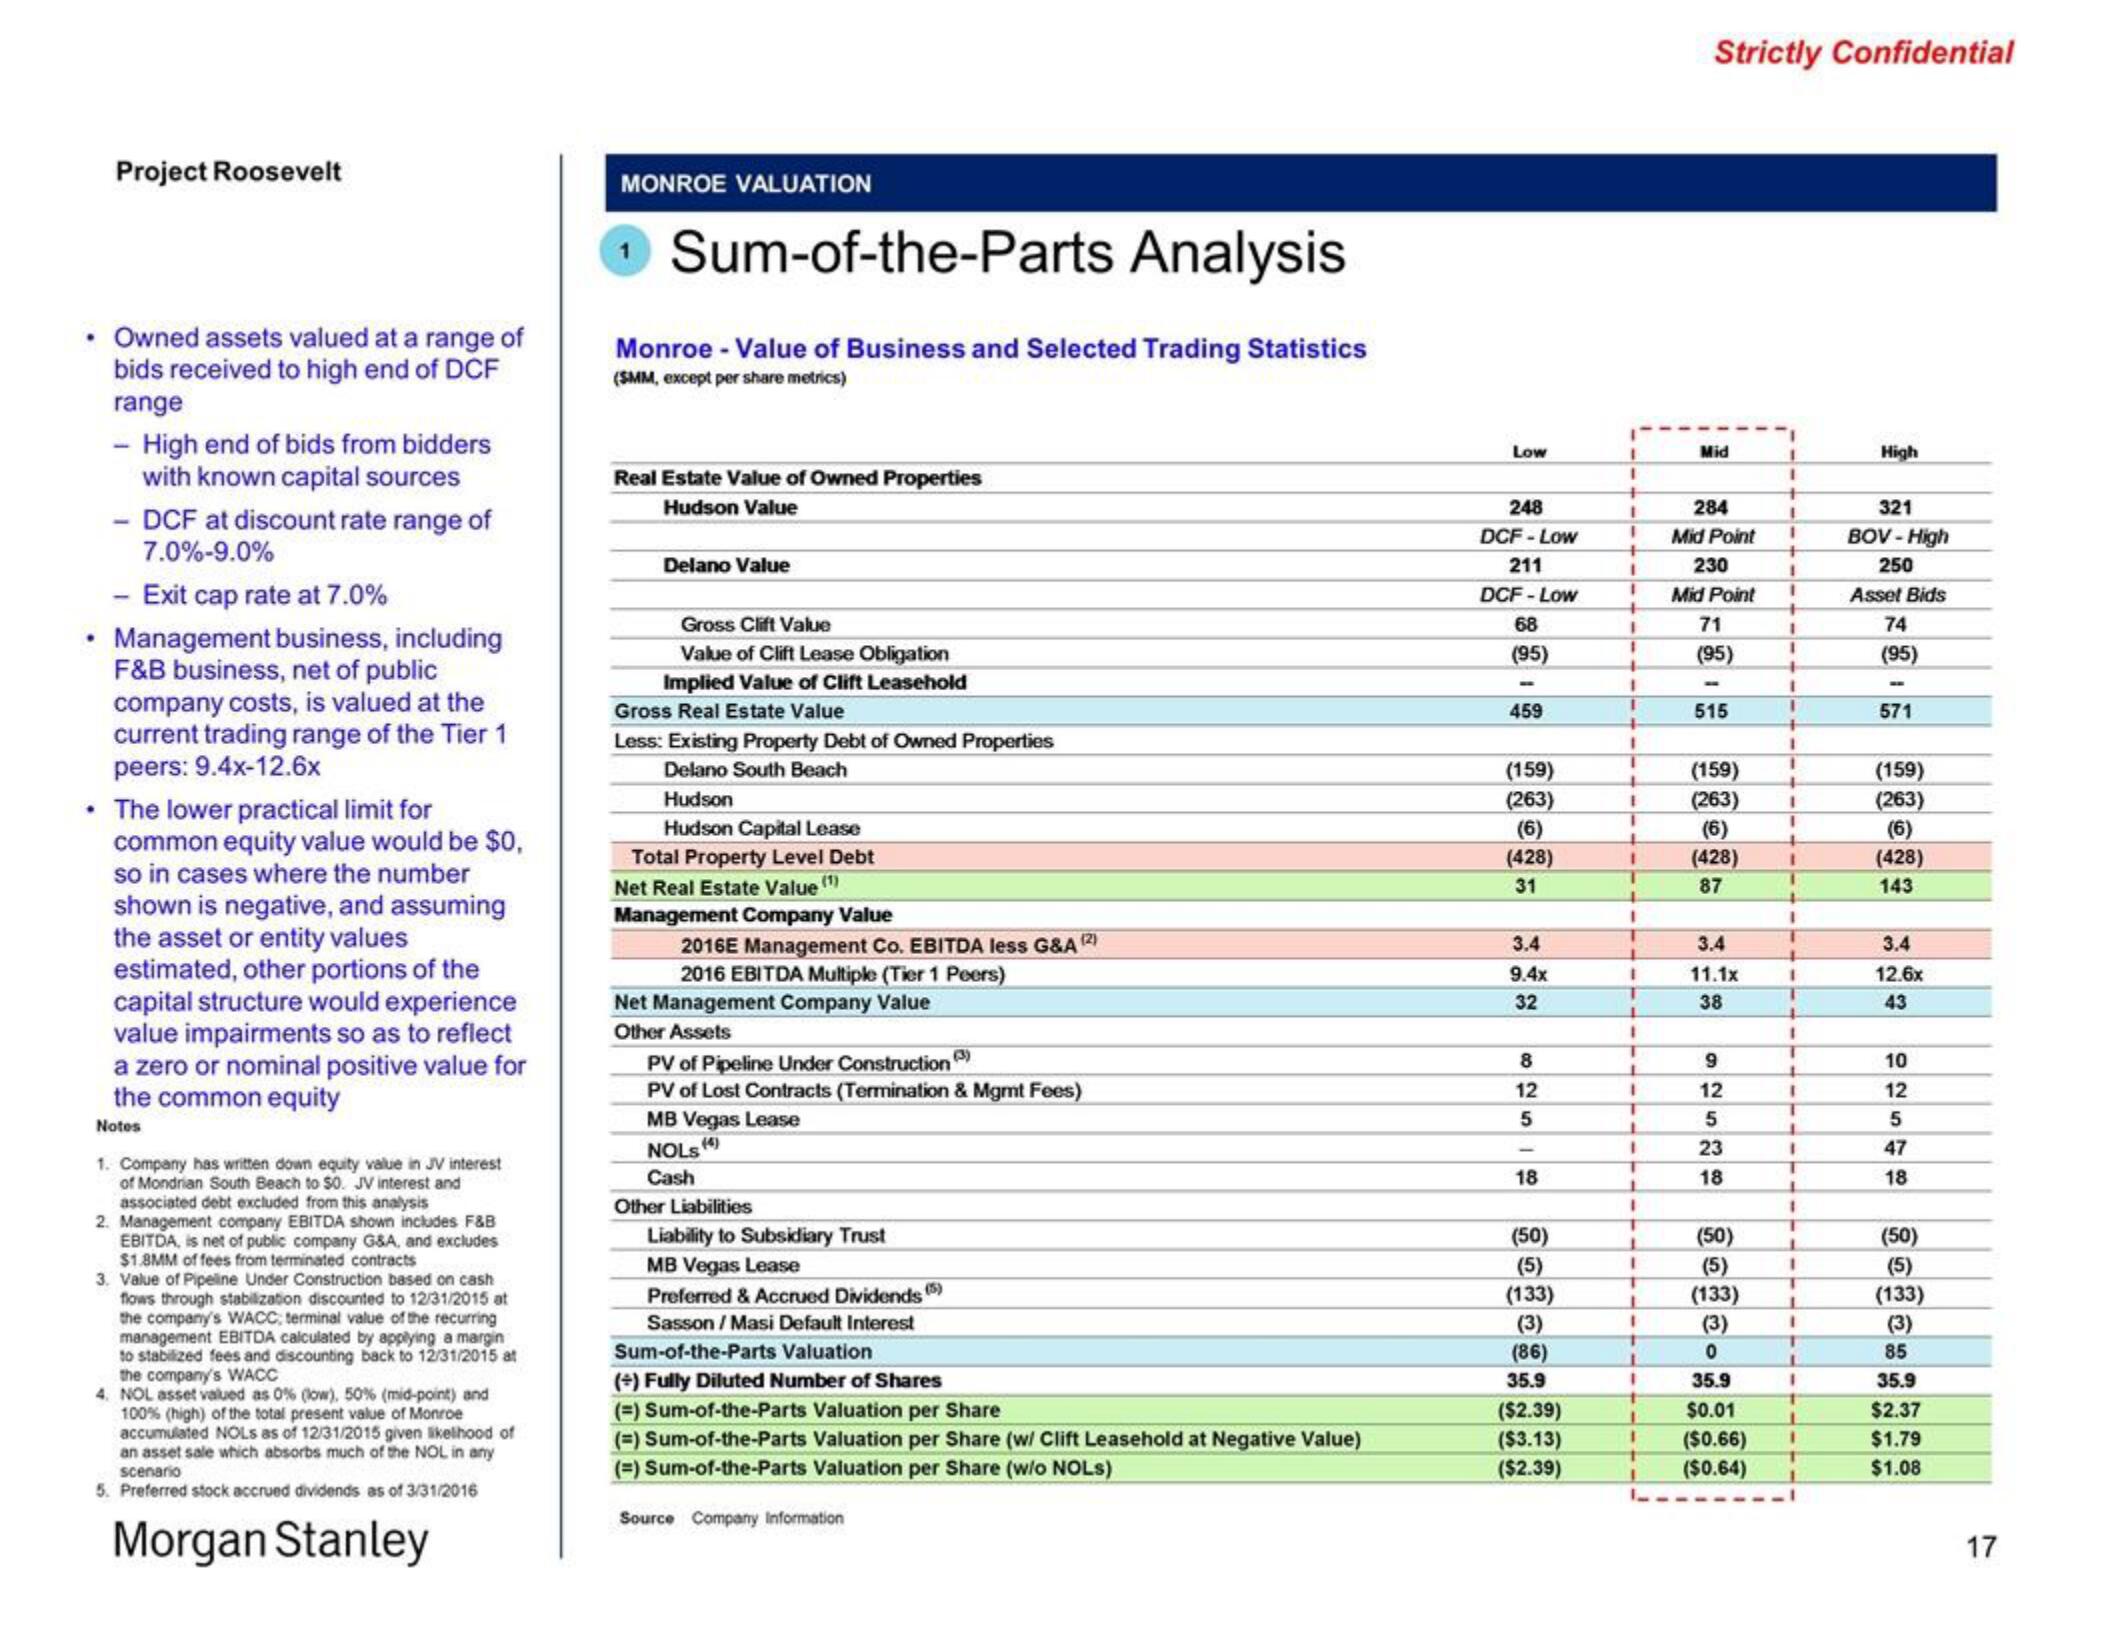
• Owned assets valued at a range of
bids received to high end of DCF
range
.
Project Roosevelt
.
- High end of bids from bidders
with known capital sources
- DCF at discount rate range of
7.0%-9.0%
- Exit cap rate at 7.0%
Management business, including
F&B business, net of public
company costs, is valued at the
current trading range of the Tier 1
peers: 9.4x-12.6x
The lower practical limit for
common equity value would be $0,
so in cases where the number
shown is negative, and assuming
the asset or entity values
estimated, other portions of the
capital structure would experience
value impairments so as to reflect
a zero or nominal positive value for
the common equity
Notes
1. Company has written down equity value in JV interest
of Mondrian South Beach to S0. JV interest and
associated debt excluded from this analysis
2. Management company EBITDA shown includes F&B
EBITDA, is net of public company G&A, and excludes
$1.8MM of fees from terminated contracts
3. Value of Pipeline Under Construction based on cash
flows through stabilization discounted to 12/31/2015 at
the company's WACC; terminal value of the recurring
management EBITDA calculated by applying a margin
to stabilized fees and discounting back to 12/31/2015 at
the company's WACC
4. NOL asset valued as 0% (low), 50% (mid-point) and
100% (high) of the total present value of Monroe
accumulated NOLS as of 12/31/2015 given likelihood of
an asset sale which absorbs much of the NOL in any
scenario
5. Preferred stock accrued dividends as of 3/31/2016
Morgan Stanley
MONROE VALUATION
Sum-of-the-Parts Analysis
Monroe - Value of Business and Selected Trading Statistics
(SMM, except per share metrics)
Real Estate Value of Owned Properties
Hudson Value
Delano Value
Gross Clift Value
Value of Clift Lease Obligation
Implied Value of Clift Leasehold
Gross Real Estate Value
Less: Existing Property Debt of Owned Properties
Delano South Beach
Hudson
Hudson Capital Lease
Total Property Level Debt
Net Real Estate Value (¹)
Management Company Value
2016E Management Co. EBITDA less G&A (2)
2016 EBITDA Multiple (Tier 1 Peers)
Net Management Company Value
Other Assets
PV of Pipeline Under Construction (3)
PV of Lost Contracts (Termination & Mgmt Fees)
MB Vegas Lease
NOLS (4)
Cash
Other Liabilities
Liability to Subsidiary Trust
MB Vegas Lease
Preferred & Accrued Dividends (5)
Sasson / Masi Default Interest
Sum-of-the-Parts Valuation
(+) Fully Diluted Number of Shares
(=) Sum-of-the-Parts Valuation per Share
(=) Sum-of-the-Parts Valuation per Share (w/ Clift Leasehold at Negative Value)
(-) Sum-of-the-Parts Valuation per Share (w/o NOLs)
Source Company Information
Low
248
DCF-Low
211
DCF-Low
68
(95)
459
(159)
(263)
(6)
(428)
31
3.4
9.4x
32
8
12
5
18
(50)
(5)
(133)
(3)
(86)
35.9
($2.39)
($3.13)
($2.39)
1
+
I
1
+
1
1
+
I
1
4
I
1
+
1
T
4
I
T
4
1
T
1
T
1
I
T
1
1
T
1
1
T
1
1
T
1
1
T
1
I
T
1
I
T
L
I
t
1
1
t
I
Strictly Confidential
Mid
284
Mid Point
230
Mid Point
71
(95)
515
(159)
(263)
(6)
(428)
87
3.4
11.1x
38
9
12
5
23
18
(50)
(5)
(133)
(3)
0
35.9
$0.01
($0.66)
($0.64)
I
I
I
I
1
+
1
1
+
1
1
+
I
1
1
1
+
I
1
+
I
T
1
T
4
T
4
I
T
J
I
T
L
1
T
1
1
T
1
I
T
L
I
1
I
1
High
321
BOV-High
250
Asset Bids
74
(95)
571
(159)
(263)
(6)
(428)
143
3.4
12.6x
43
10
12
5
47
18
(50)
(5)
(133)
(3)
85
35.9
$2.37
$1.79
$1.08
17View entire presentation