Bed Bath & Beyond Results Presentation Deck
Q2 2020 FINANCIAL RESULTS
Q2 key p&l metrics
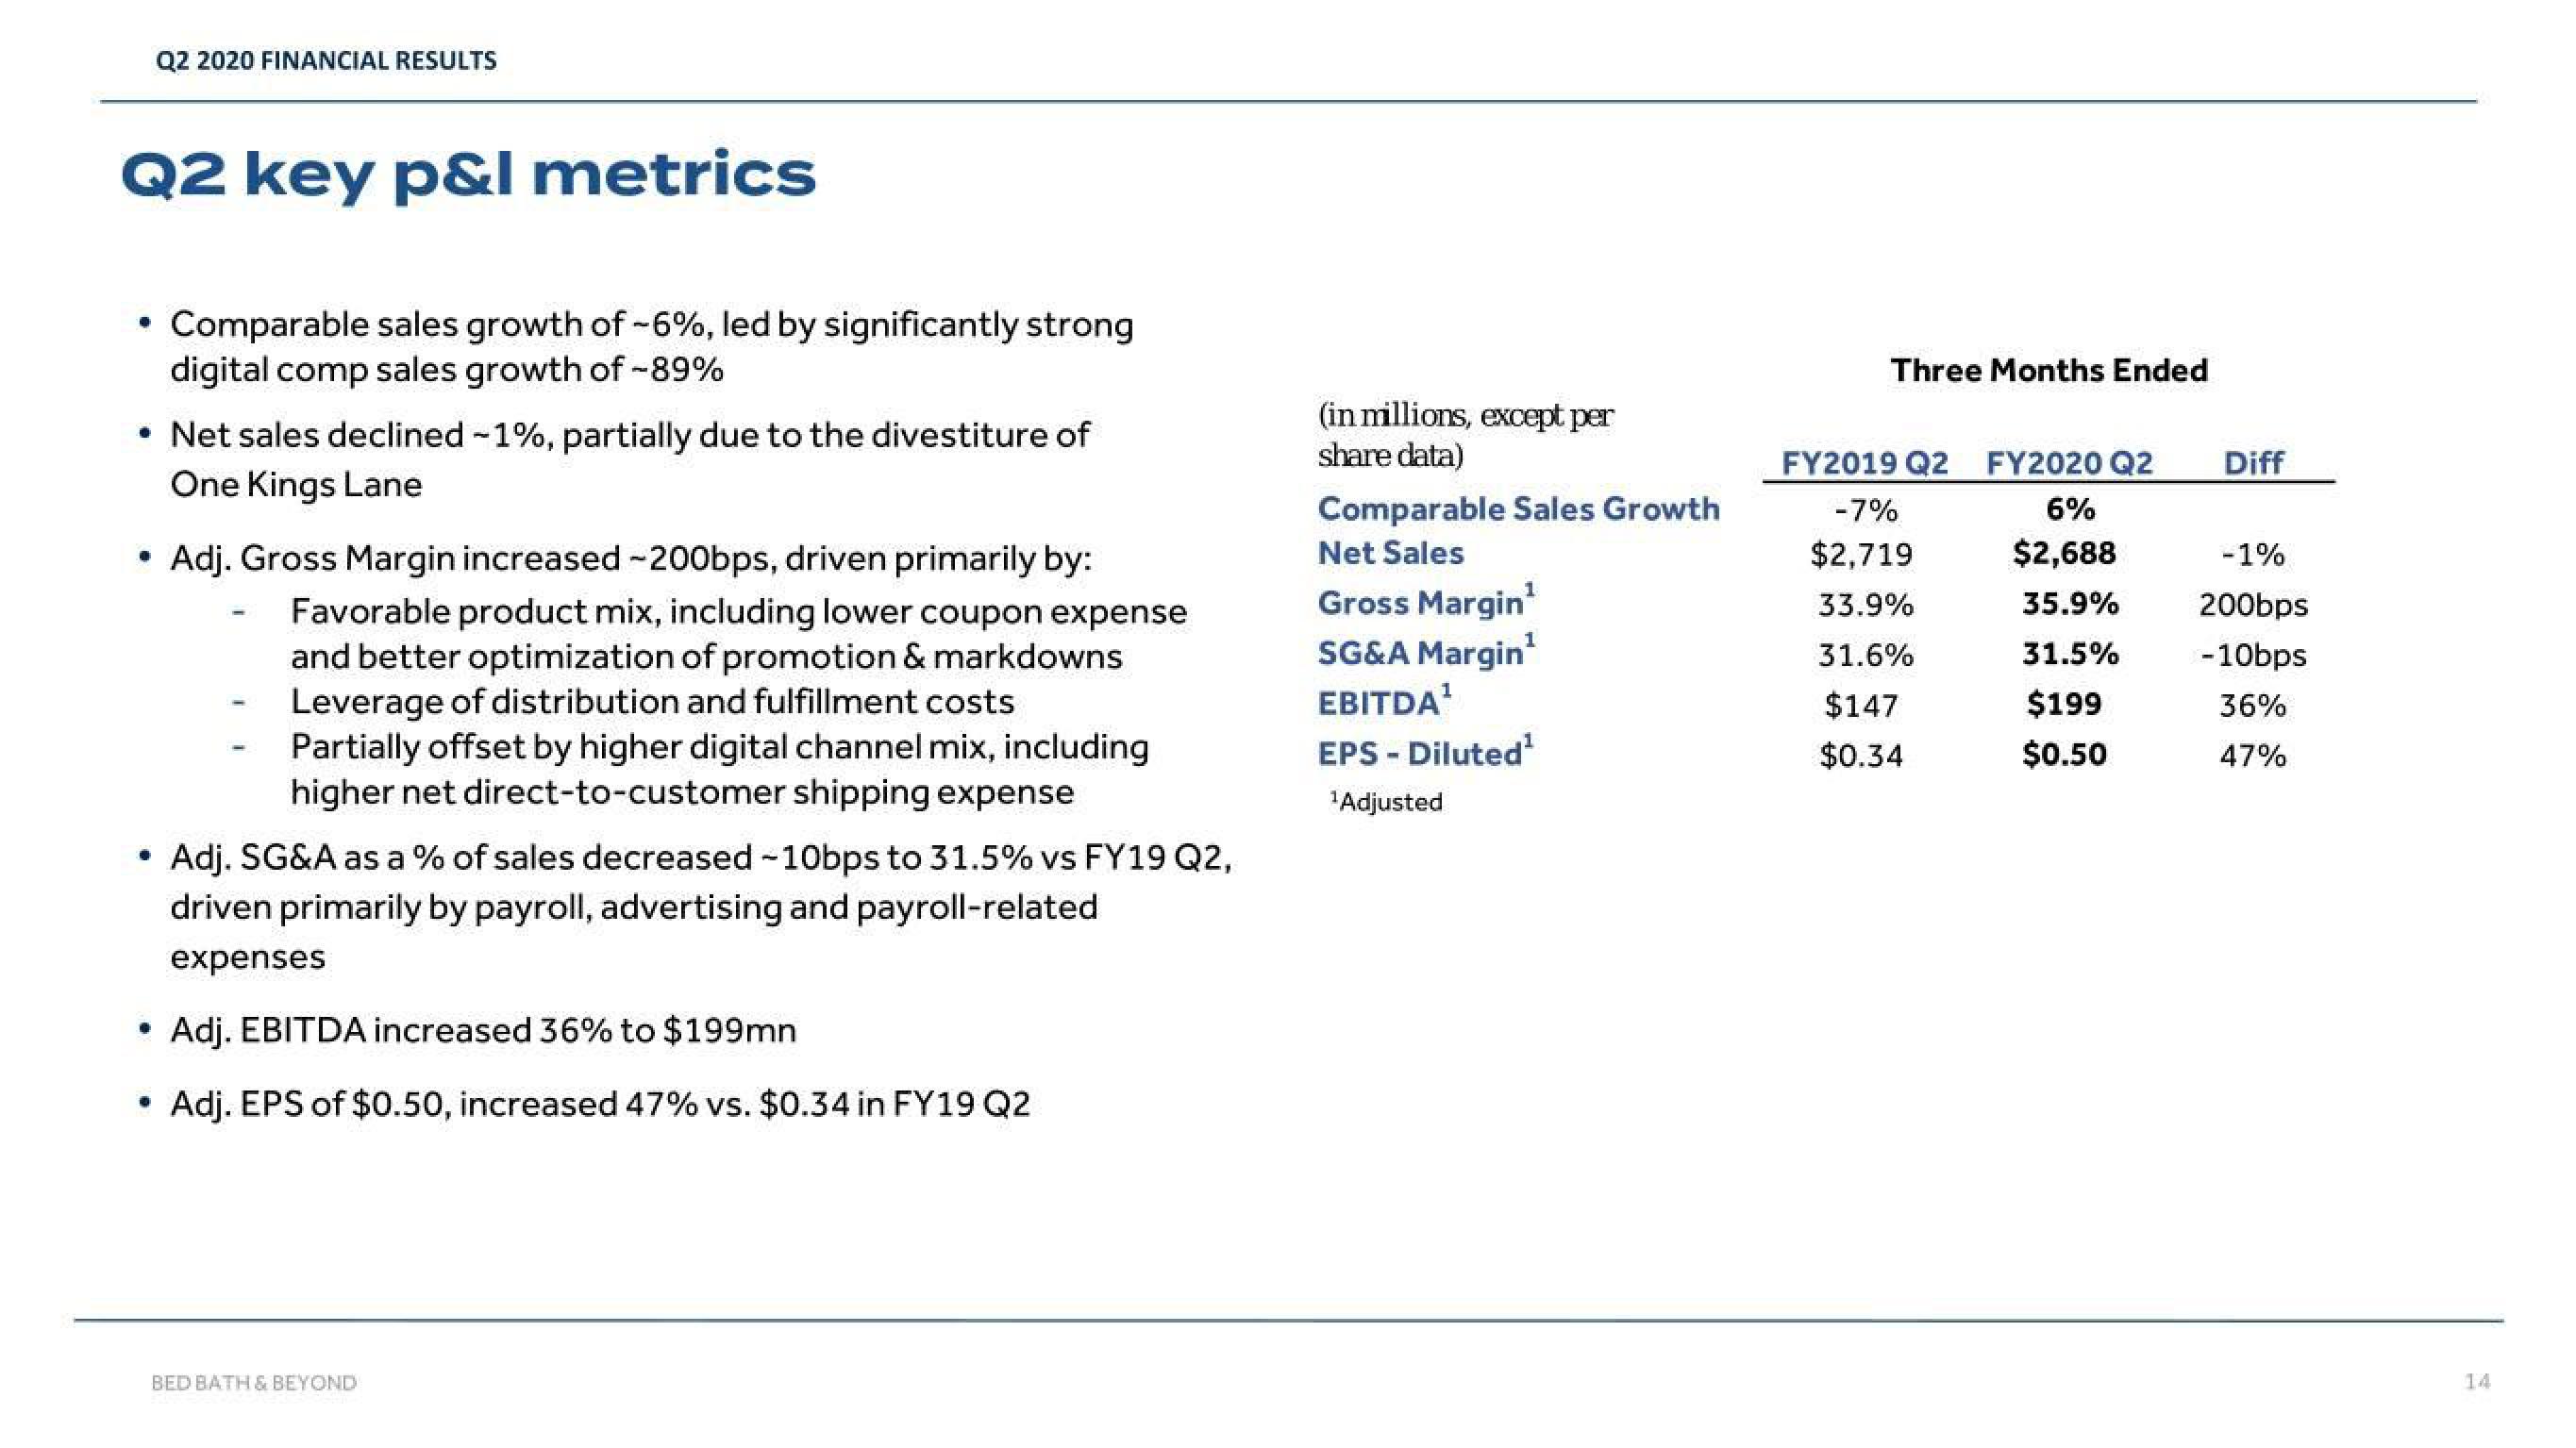
• Comparable sales growth of -6%, led by significantly strong
digital comp sales growth of -89%
• Net sales declined -1%, partially due to the divestiture of
One Kings Lane
.
Adj. Gross Margin increased ~200bps, driven primarily by:
Favorable product mix, including lower coupon expense
and better optimization of promotion & markdowns
Leverage of distribution and fulfillment costs
Partially offset by higher digital channel mix, including
higher net direct-to-customer shipping expense
-
Adj. SG&A as a % of sales decreased ~10bps to 31.5% vs FY19 Q2,
driven primarily by payroll, advertising and payroll-related
expenses
Adj. EBITDA increased 36% to $199mn
Adj. EPS of $0.50, increased 47% vs. $0.34 in FY19 Q2
BED BATH & BEYOND
(in millions, except per
share data)
Comparable Sales Growth
Net Sales
Gross Margin¹
SG&A Margin¹
EBITDA¹
EPS - Diluted¹
¹Adjusted
Three Months Ended
FY2019 Q2 FY2020 Q2
-7%
6%
$2,719 $2,688
33.9%
35.9%
31.6%
$147
$0.34
31.5%
$199
$0.50
Diff
-1%
200bps
- 10bps
36%
47%
14View entire presentation