SoftBank Results Presentation Deck
Consolidated P/L Summary
P/L item
Net sales
Gross profit
Gain/loss on investments
Investment Business of Holding
Companies
SoftBank Vision Funds
Other investments
Total gain on investments
Selling, general and administrative
expenses
Finance cost
Foreign exchange loss
Income/loss on equity method
investments
Derivative gain/loss (excl. gain /loss
on investments)
Change in third-party interests in SVF
Other gain/loss
Income before income tax
Income taxes
Net income
Net income attributable to owners
of the parent
(\B)
FY22Q1 FY23Q1 Change
1,572.0 1,557.5
883.8
832.1
-689.7
-800.9
+2,906.1
111.2 1
-2,919.1 2 -13.0
-26.5
3.8
+30.3
-699.0 +2,135.5
-2,834.4
-626.5
-648.1
-114.1 3 -139.6
-820.0 4
-464.6
-158.4
-18.3
-259.35
631.4
5.1 6
-3,292.5
196.1 7
-14.5
-51.7
-3,096.3
-3,162.7 -477.6
-21.6
-25.5
+355.3
+140.1
849.6
-58.1
169.8
-176.2
-140.0
-316.2 +2,780.1
+2,685.1
+1,108.9
-689.4
+164.7
+3,116.3
-336.1
=SoftBank
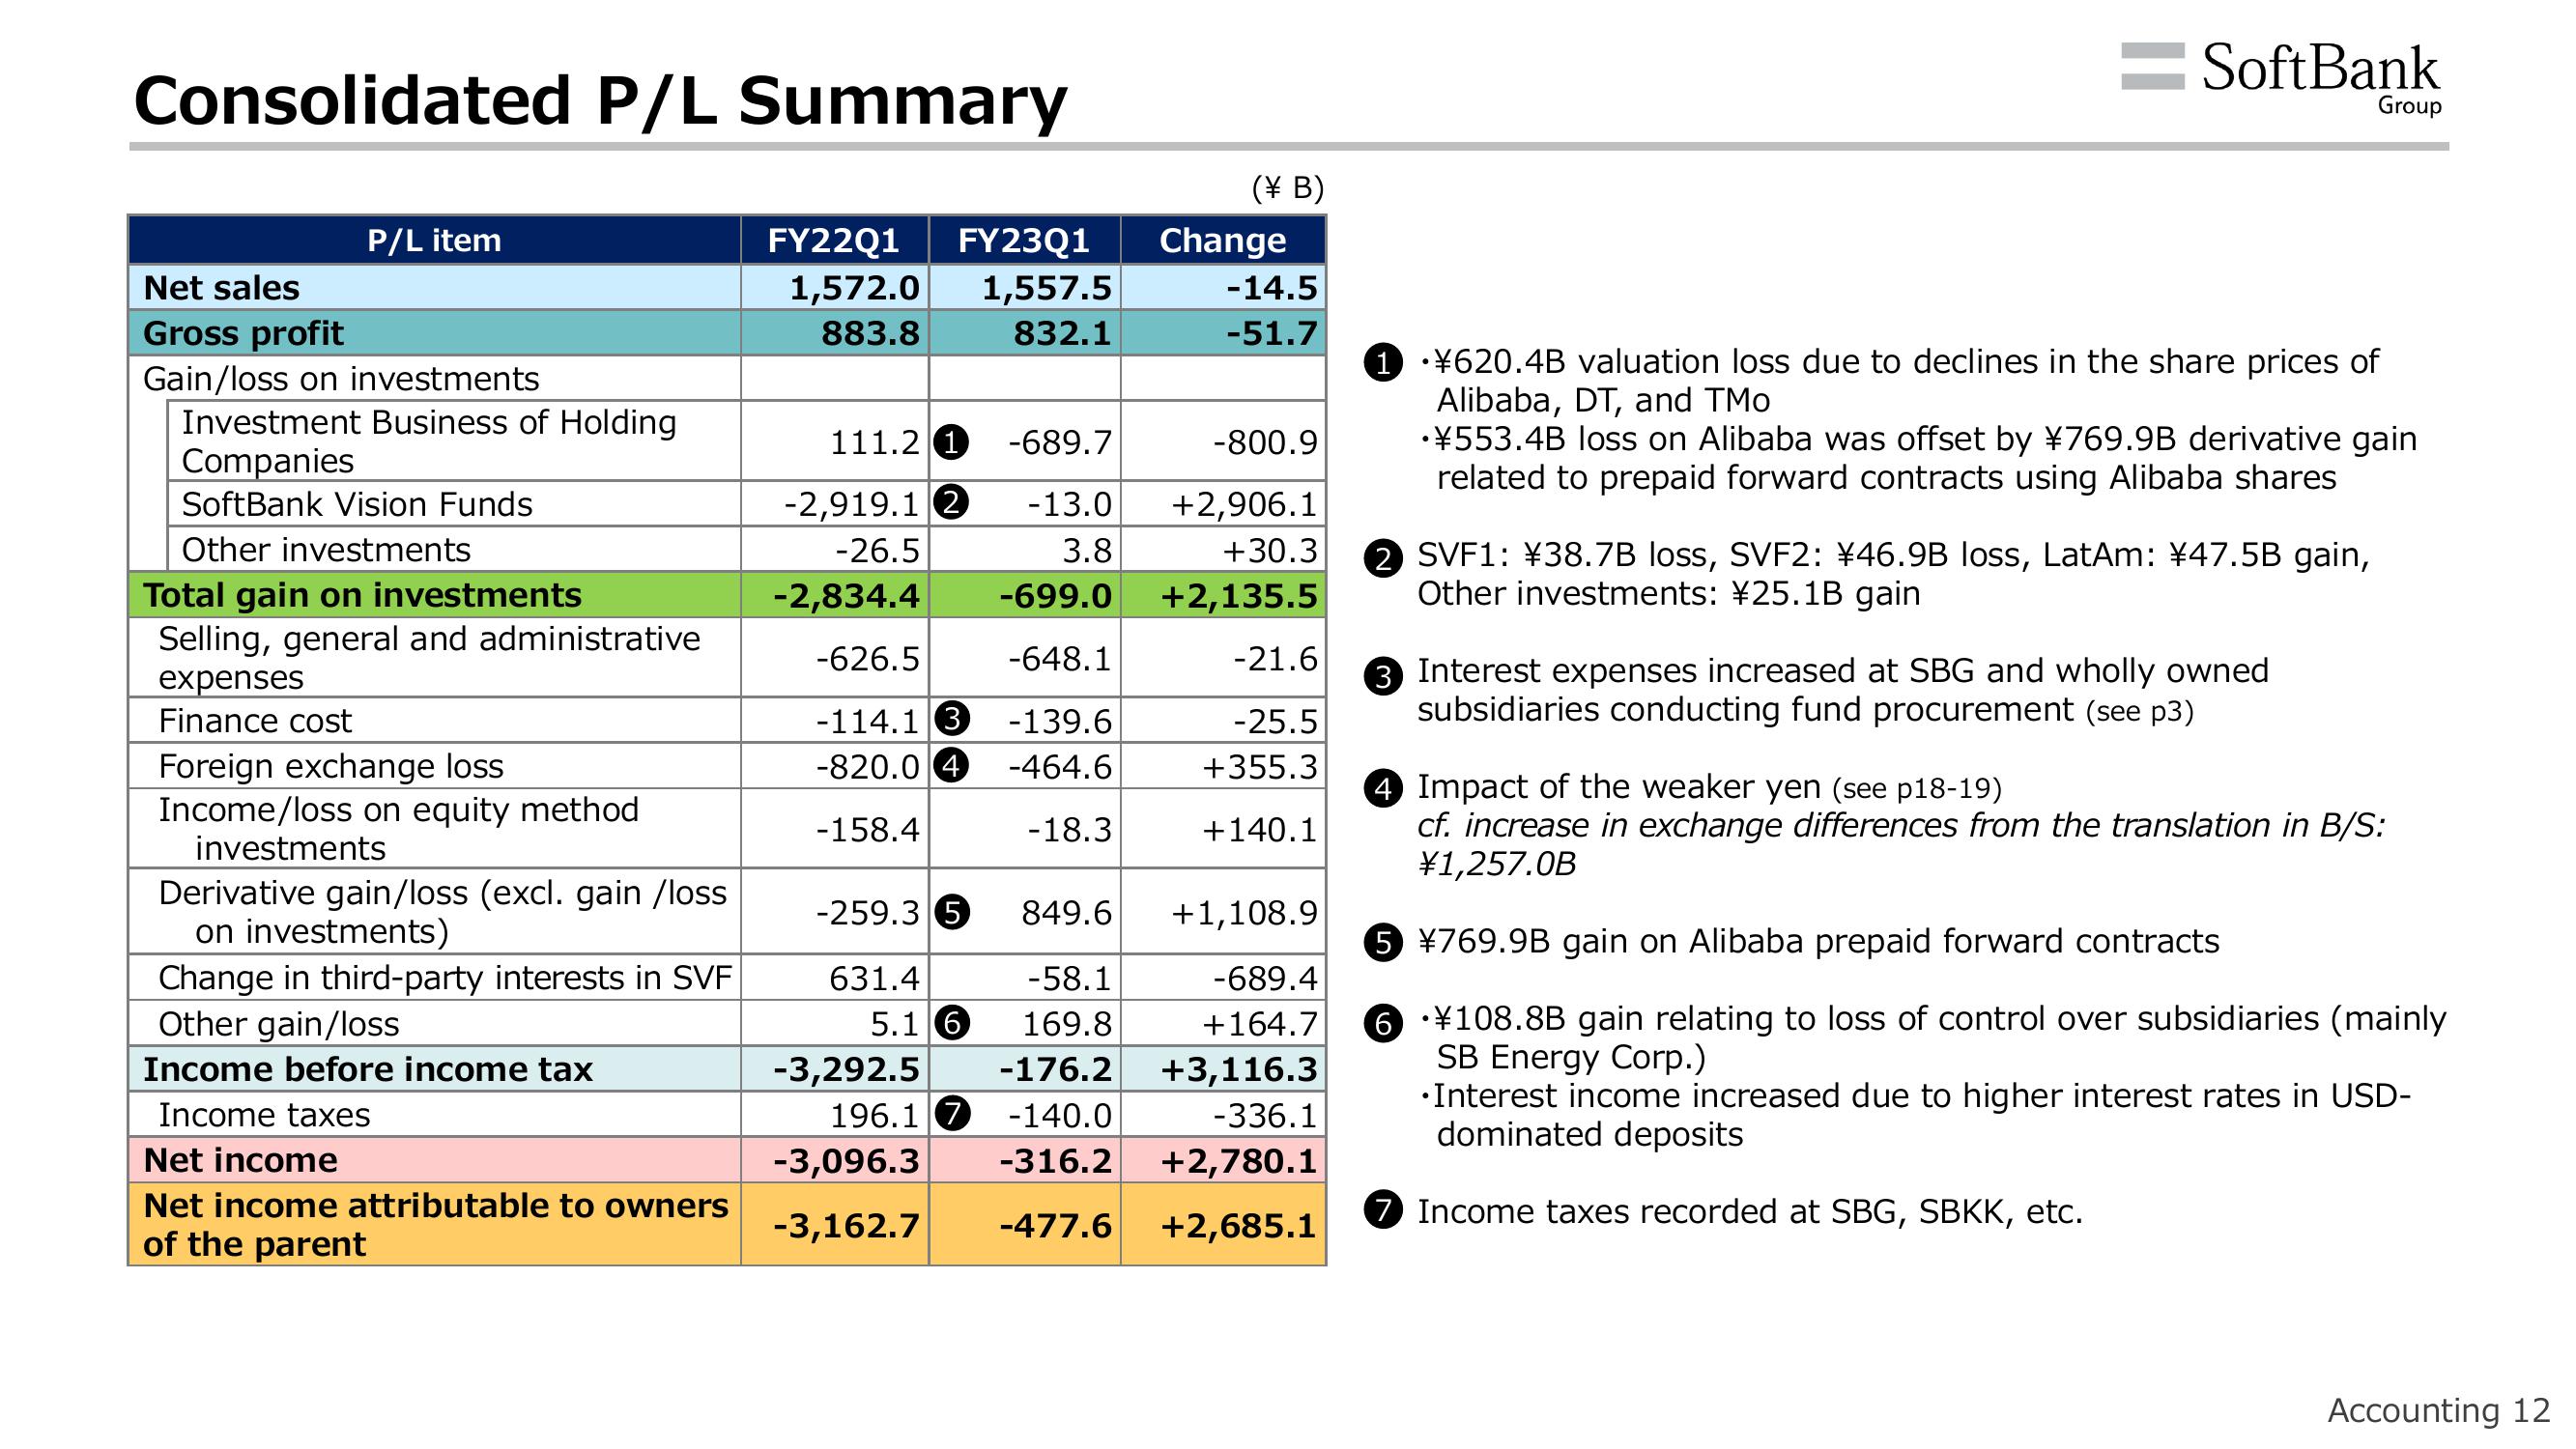
1 •¥620.4B valuation loss due to declines in the share prices of
Alibaba, DT, and TMo
•¥553.4B loss on Alibaba was offset by ¥769.9B derivative gain
related to prepaid forward contracts using Alibaba shares
2 SVF1: ¥38.7B loss, SVF2: ¥46.9B loss, LatAm: ¥47.5B gain,
Other investments: ¥25.1B gain
Group
3 Interest expenses increased at SBG and wholly owned
subsidiaries conducting fund procurement (see p3)
4 Impact of the weaker yen (see p18-19)
cf. increase in exchange differences from the translation in B/S:
¥1,257.0B
5 ¥769.9B gain on Alibaba prepaid forward contracts
6 ¥108.8B gain relating to loss of control over subsidiaries (mainly
SB Energy Corp.)
•Interest income increased due to higher interest rates in USD-
dominated deposits
7 Income taxes recorded at SBG, SBKK, etc.
Accounting 12View entire presentation