JD Sports Results Presentation Deck
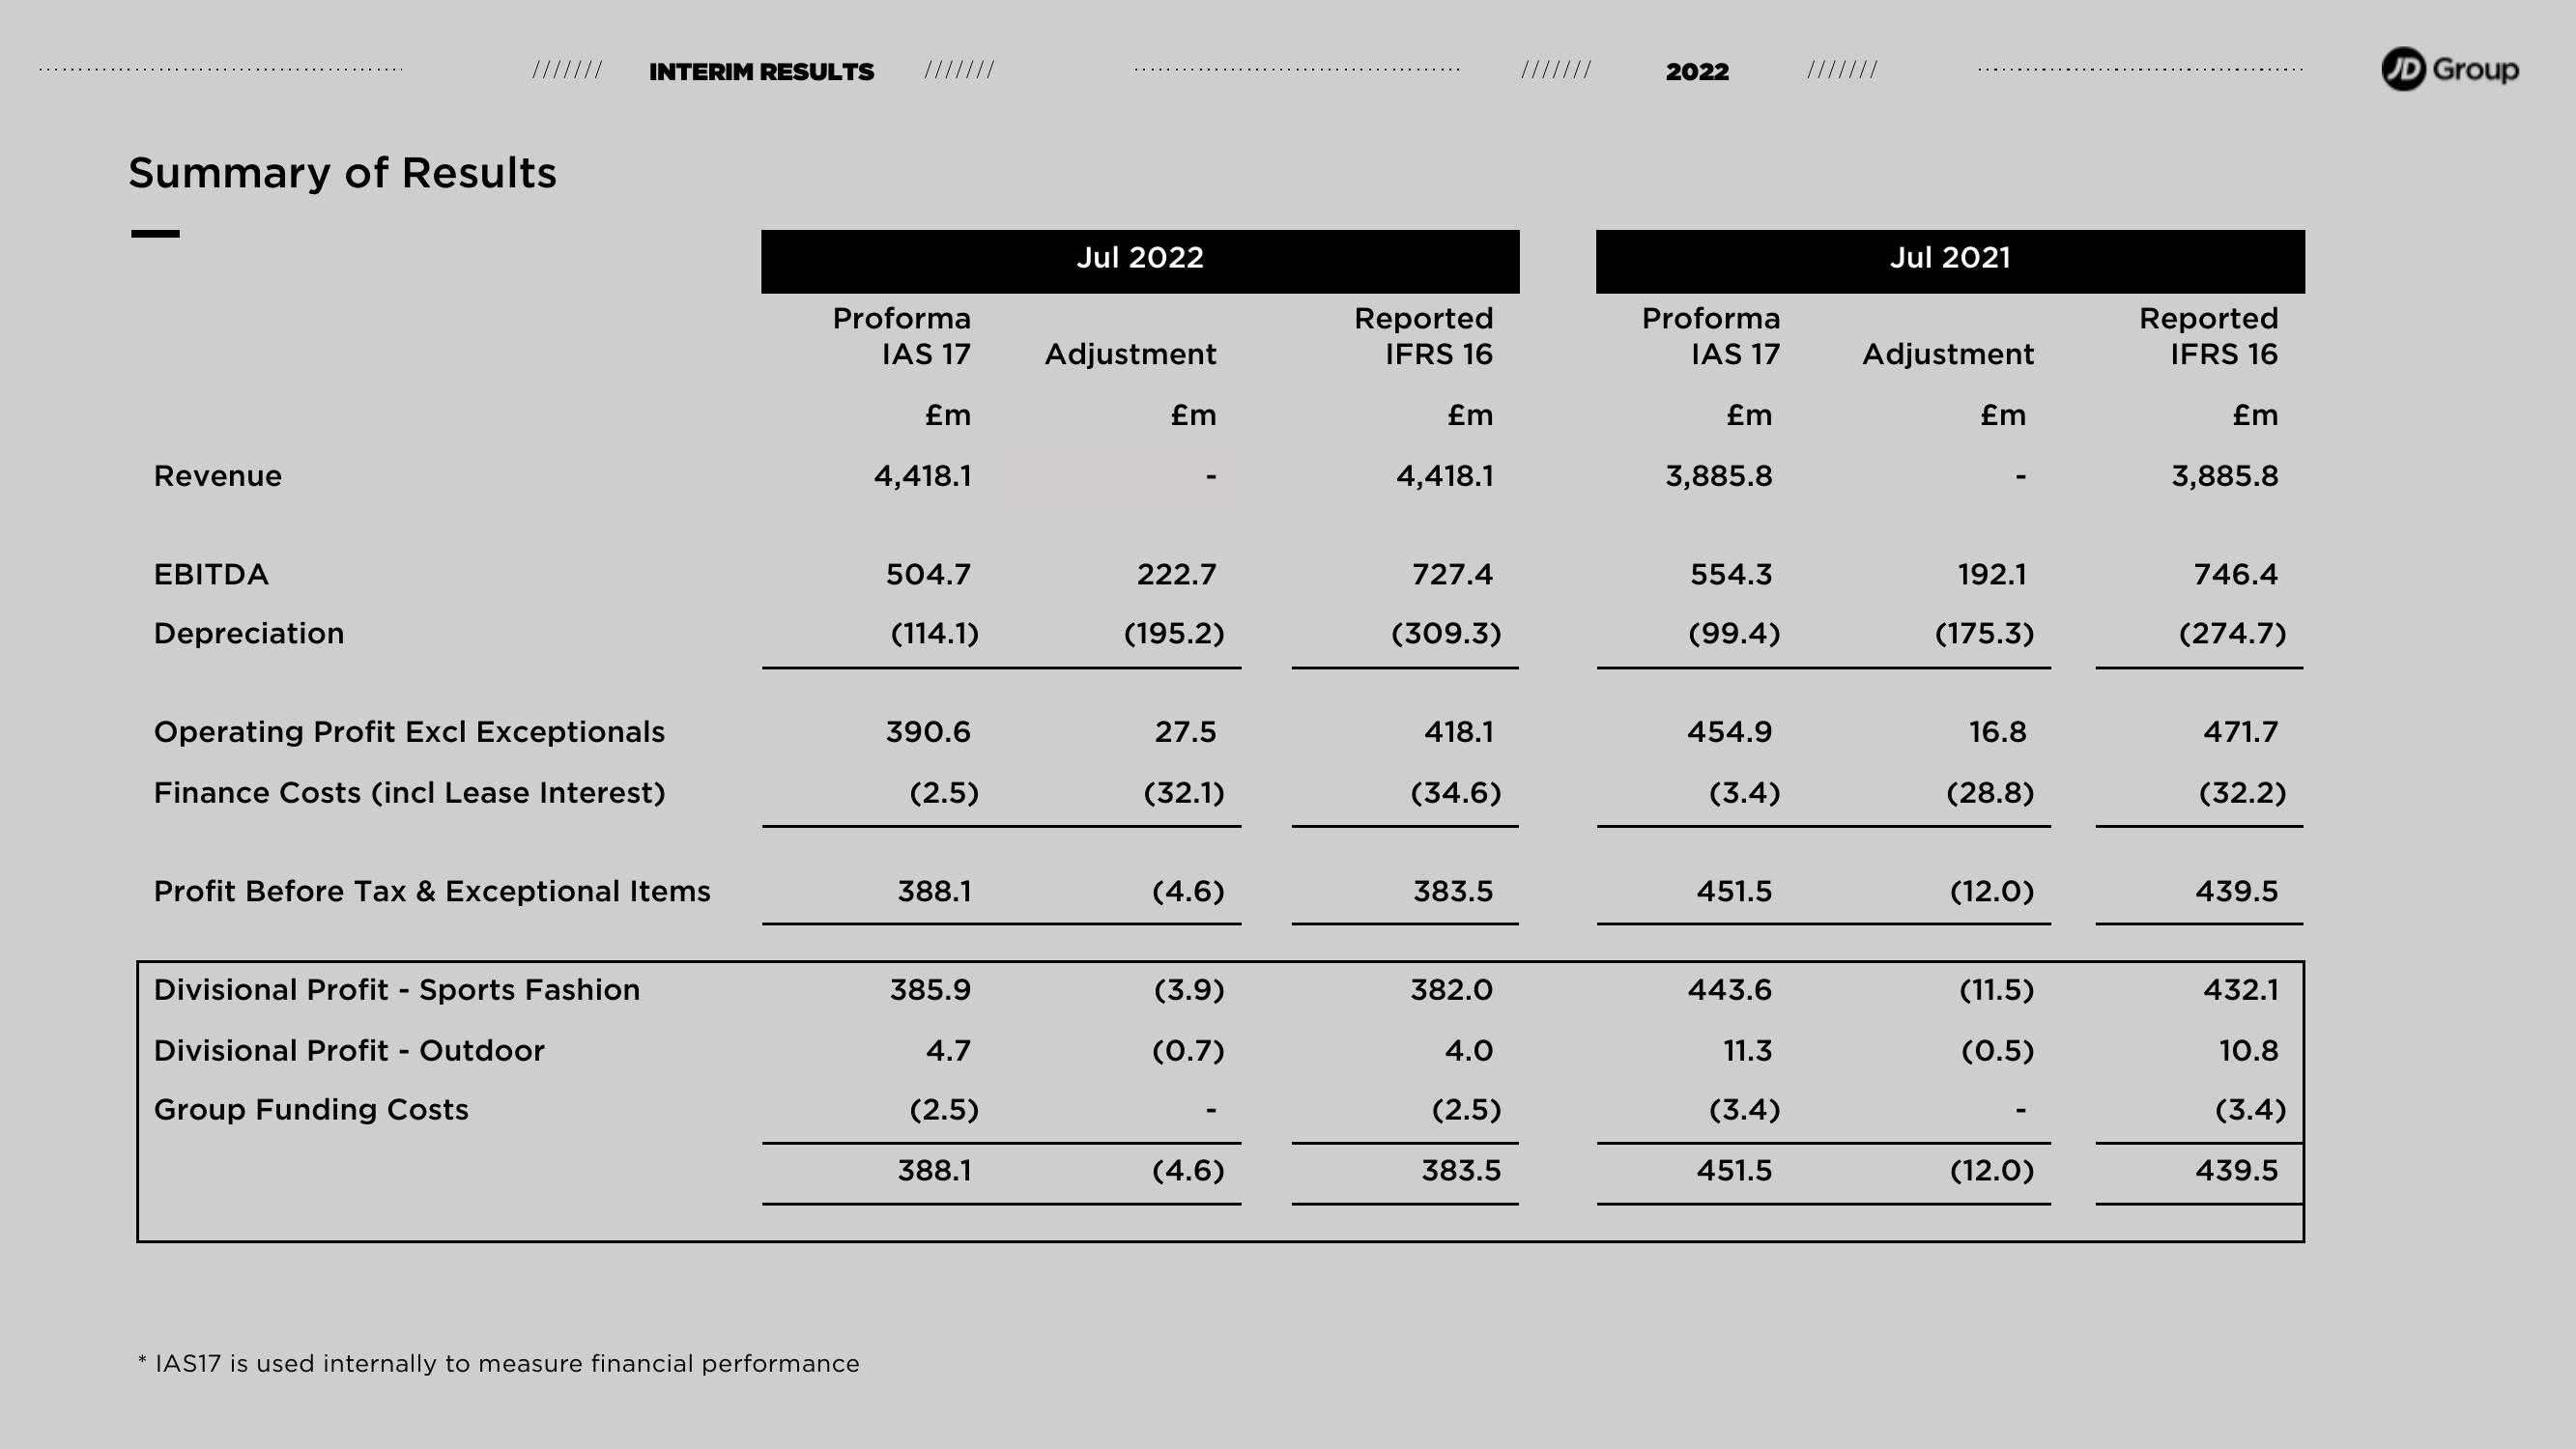
Summary of Results
Revenue
EBITDA
Depreciation
INTERIM RESULTS ///////
Operating Profit Excl Exceptionals
Finance Costs (incl Lease Interest)
Profit Before Tax & Exceptional Items
Divisional Profit - Sports Fashion
Divisional Profit - Outdoor
Group Funding Costs
Proforma
IAS 17
£m
* IAS17 is used internally to measure financial performance
4,418.1
504.7
(114.1)
390.6
(2.5)
388.1
385.9
4.7
(2.5)
388.1
Jul 2022
Adjustment
£m
222.7
(195.2)
27.5
(32.1)
(4.6)
(3.9)
(0.7)
(4.6)
Reported
IFRS 16
£m
4,418.1
727.4
(309.3)
418.1
(34.6)
383.5
382.0
4.0
(2.5)
383.5
///////
2022
Proforma
IAS 17
£m
3,885.8
554.3
(99.4)
454.9
(3.4)
451.5
443.6
11.3
(3.4)
451.5
Jul 2021
Adjustment
£m
192.1
(175.3)
16.8
(28.8)
(12.0)
(11.5)
(0.5)
(12.0)
Reported
IFRS 16
£m
3,885.8
746.4
(274.7)
471.7
(32.2)
439.5
432.1
10.8
(3.4)
439.5
JD GroupView entire presentation