Zegna Results Presentation Deck
FY 2021 RESULTS - REVENUES RECAP
€ Million
1,400
1,200
1,000
800
600
400
200
0
-200
€ Million
1,400
1,200
1,000
800
600
400
-6
200
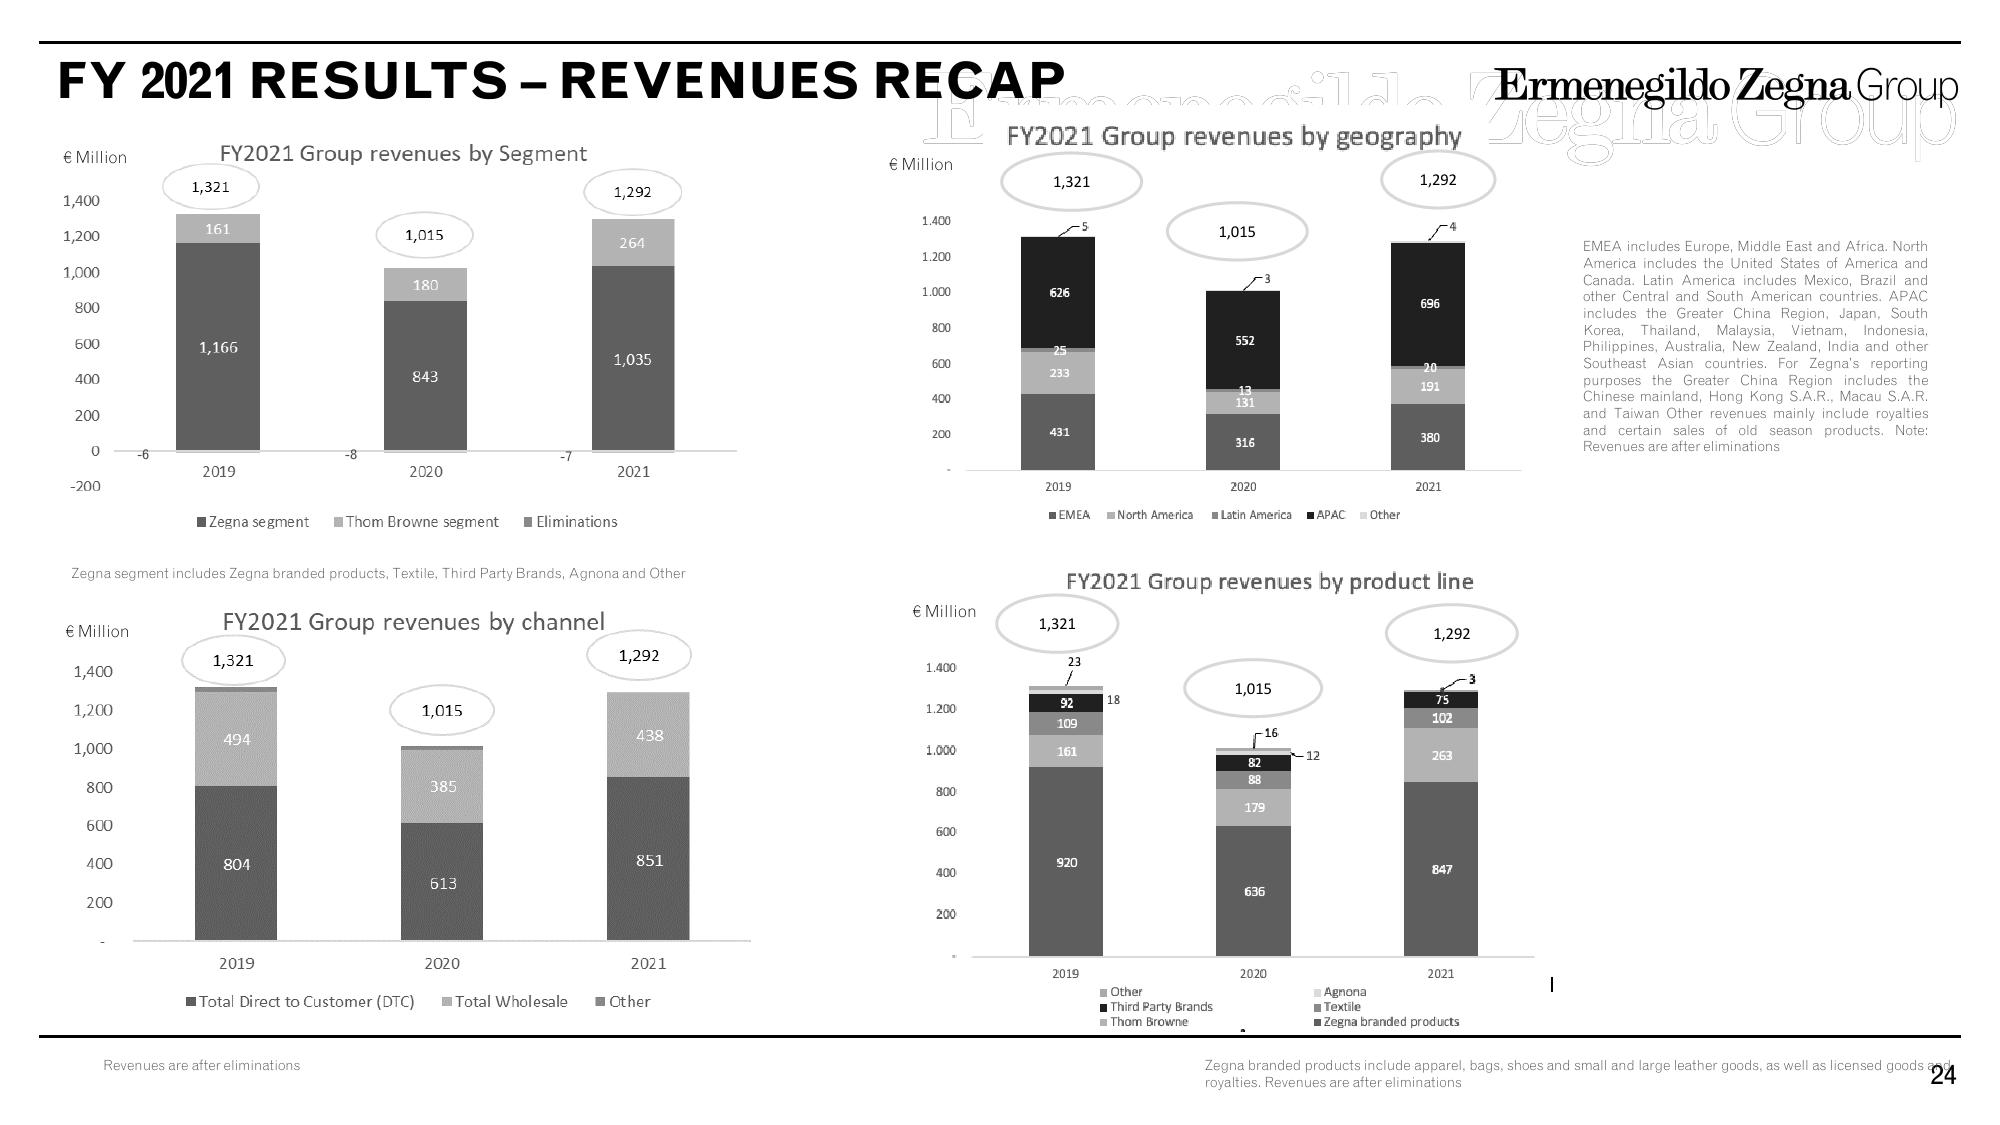
FY2021 Group revenues by Segment
1,321
161
1,166
2019
Zegna segment includes Zegna branded products, Textile, Third Party Brands, Agnona and Other
1,321
494
-8
804
1,015
2019
180
FY2021 Group revenues by channel
843
Zegna segment Thom Browne segment ■Eliminations
Revenues are after eliminations
2020
1,015
385
613
1,292
2020
Total Direct to Customer (DTC) Total Wholesale
264
1,035
2021
1,292
438
851
2021
Other
€ Million
1.400
1.200
1.000
800
600
400
200
€ Million
1.400
1.200
1,000
800
600
400
200
V
FY2021 Group revenues by geography menegildo Zegna Group
1,321
1626
25
233
431
2019
EMEA North America
1,321
5
23
92
109
161
920
2019
18
1,015
Other
Third Party Brands
Thom Browne
552
131
316
FY2021 Group revenues by product line
2020
Latin America APAC Other
1,015
-16
82
88
179
636
2020
1,292
12
696
20
191
380
2021
1,292
75
102
263
847
2021
Agnona
Textile
Zegna branded products
EMEA includes Europe, Middle East and Africa. North
America includes the United States of America and
Canada. Latin America includes Mexico, Brazil and
other Central and South American countries. APAC
includes the Greater China Region, Japan, South
Korea, Thailand, Malaysia, Vietnam, Indonesia,
Philippines, Australia, New Zealand, India and other
Southeast Asian countries. For Zegna's reporting
purposes the Greater China Region includes the
Chinese mainland, Hong Kong S.A.R., Macau S.A.R.
and Taiwan Other revenues mainly include royalties
and certain sales of old season products. Note:
Revenues are after eliminations
Zegna branded products include apparel, bags, shoes and small and large leather goods, as well as licensed goods a
24
royalties. Revenues are after eliminationsView entire presentation