Q2 Quarter 2023
Noninterest Income
% Change vs
$ in millions
Q2 23
Q1 23
Q2 22
Q1 23
Q2 22
Service charges on deposit accounts
$12.9
$12.4
$ 11.4
4 %
13 %
Wealth management fees
7.4
7.4
7.2
1
3
Debit and credit card fees
8.0
8.0
8.2
(3)
Mortgage lending income
2.4
1.6
2.2
53
7
Bank owned life insurance
2.6
3.0
2.6
(14)
Other service charges and fees
2.3
2.3
1.9
(1)
21
Other
9.8
7.3
6.8
35
44
45.4
41.9
40.3
8
13
Gain (loss) on sale of securities
(0.4)
(0.2)
NM
NM
Legal reserve recapture
4.0
NM
Total noninterest income
$45.0
$45.8
$40.2
(2) %
12 %
Adjusted noninterest income¹
$45.0
$45.8
$40.3
(2) %
12 %
$5
Q2 23 Highlights
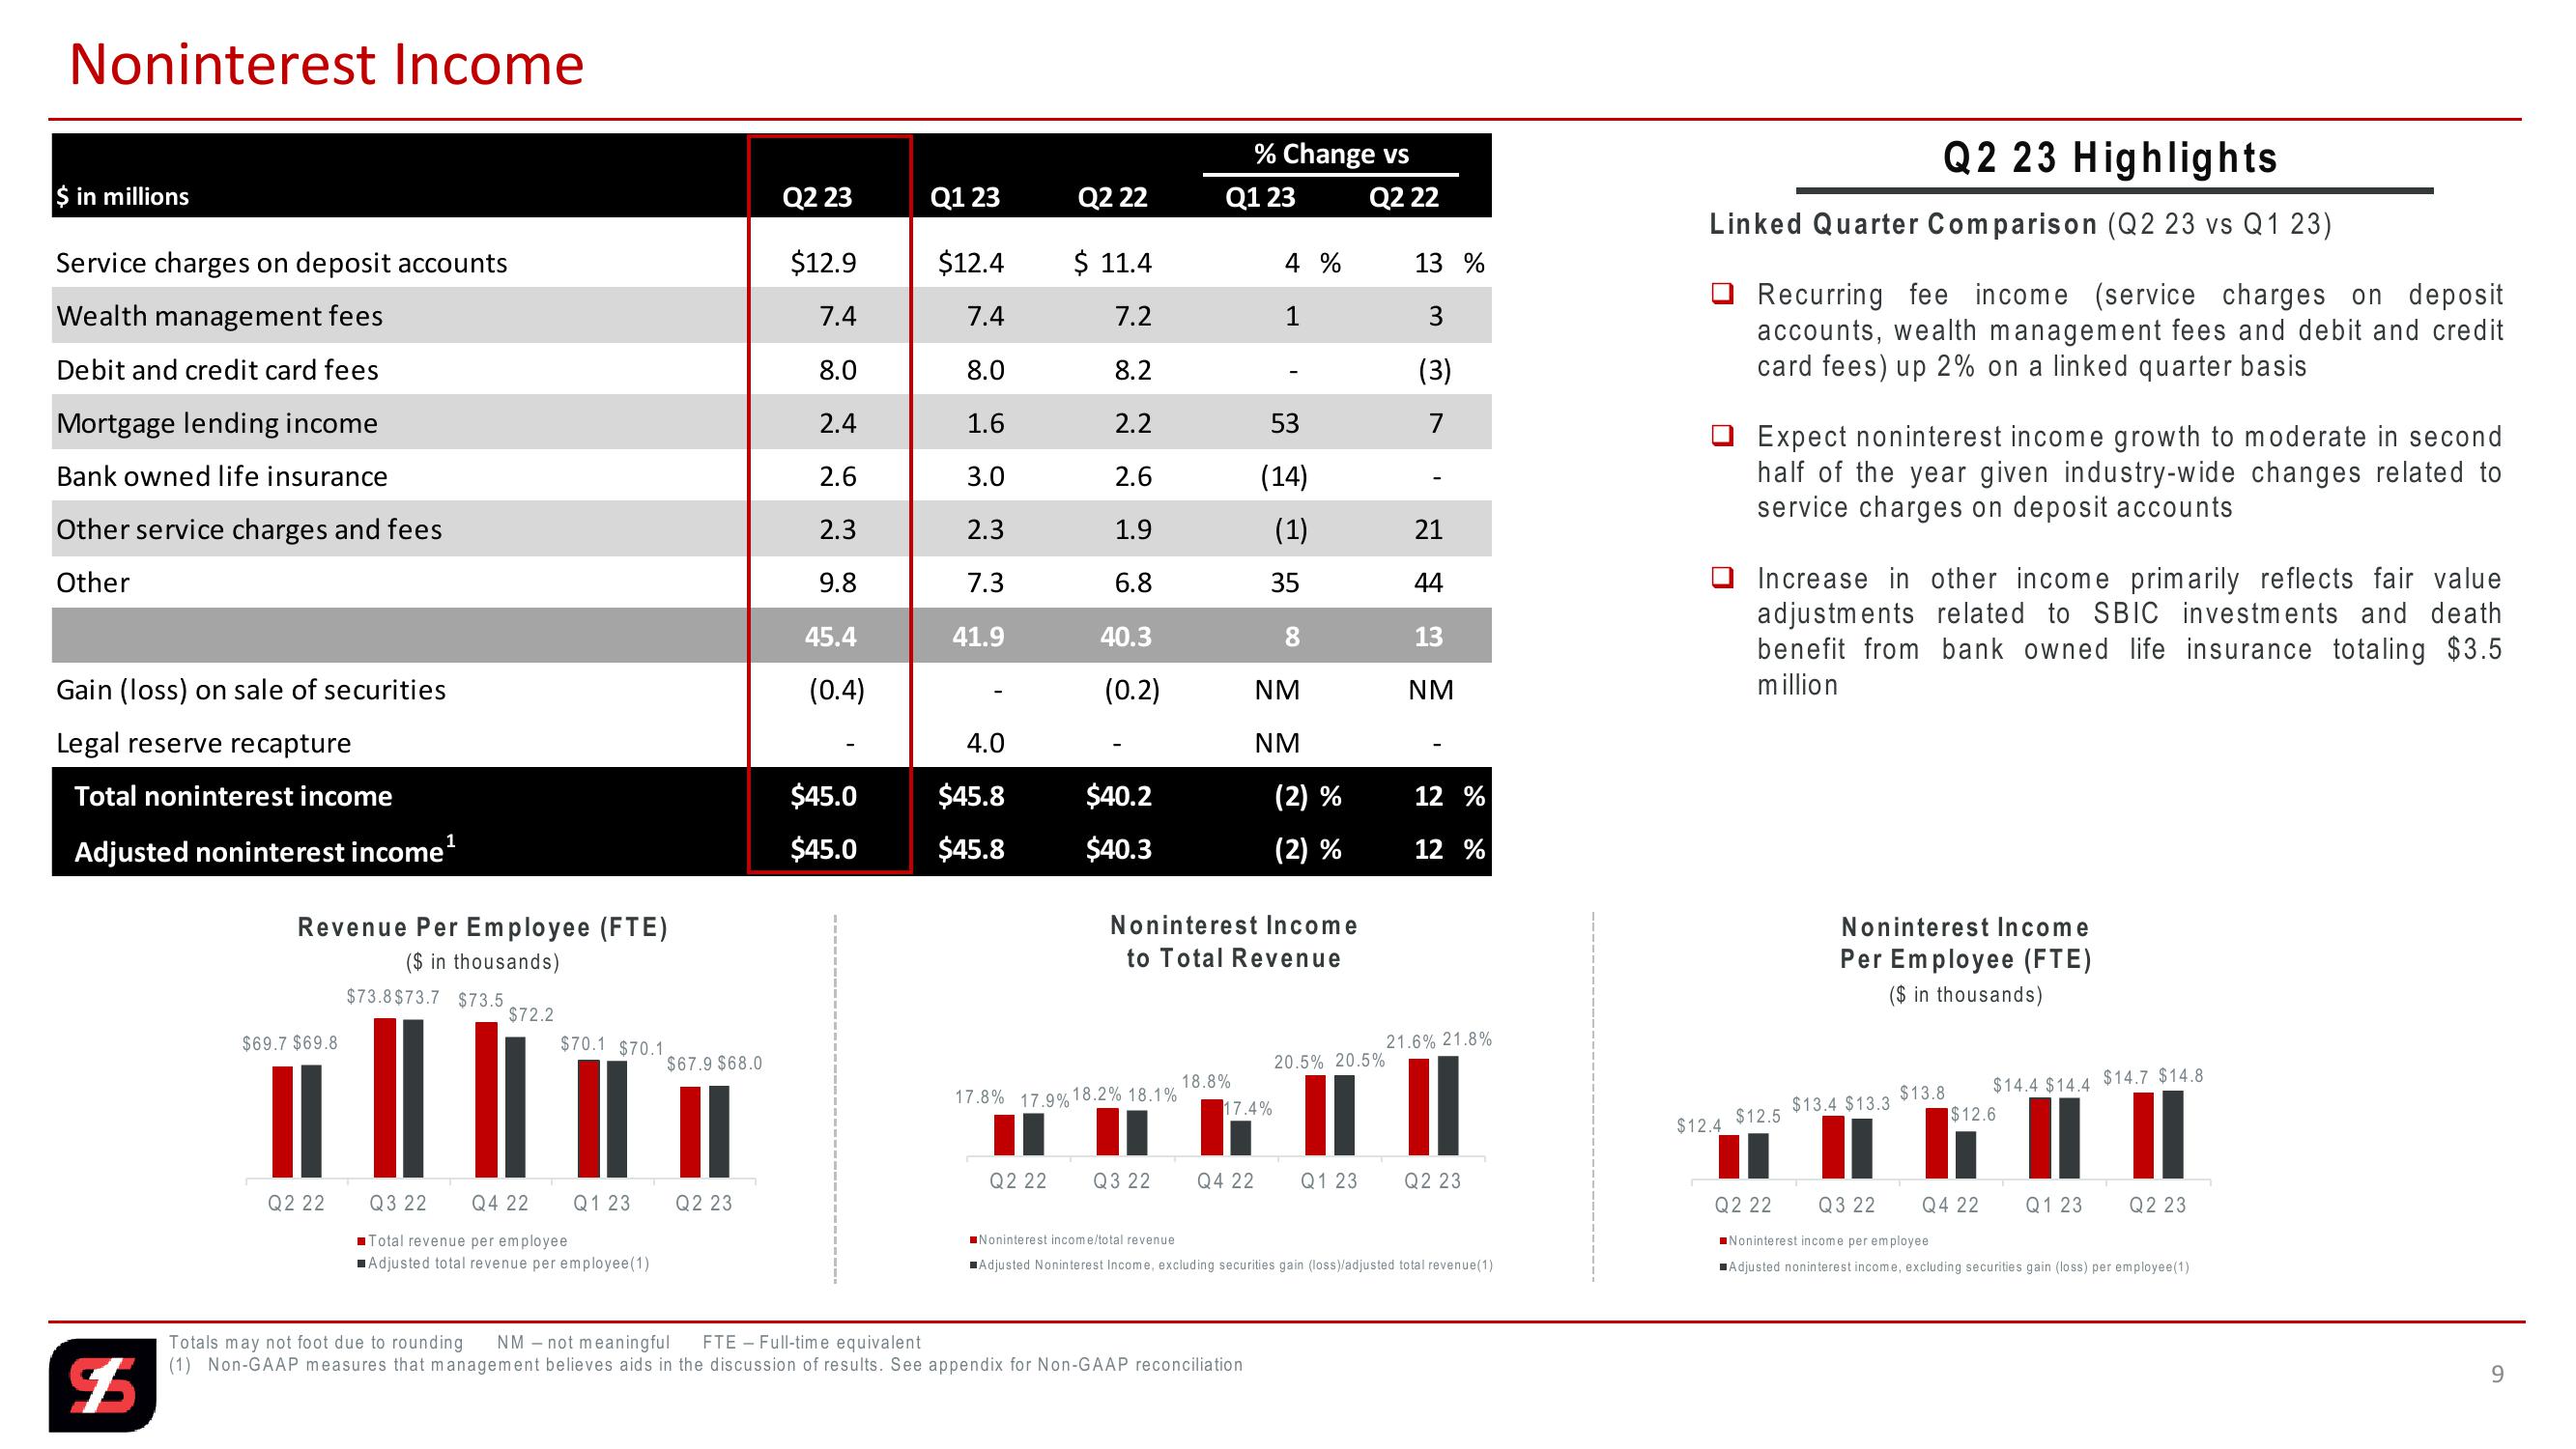
Linked Quarter Comparison (Q2 23 vs Q1 23)
Recurring fee income (service charges on deposit
accounts, wealth management fees and debit and credit
card fees) up 2% on a linked quarter basis
Expect noninterest income growth to moderate in second
half of the year given industry-wide changes related to
service charges on deposit accounts
Increase in other income primarily reflects fair value
adjustments related to SBIC investments and death
benefit from bank owned life insurance totaling $3.5
million
Revenue Per Employee (FTE)
($ in thousands)
Noninterest Income
to Total Revenue
$73.8$73.7 $73.5
$72.2
$69.7 $69.8
$70.1 $70.1.
21.6% 21.8%
$67.9 $68.0
20.5% 20.5%
18.8%
17.8% 17.9% 18.2% 18.1%
17.4%
Noninterest Income
Per Employee (FTE)
($ in thousands)
$13.8
$14.4 $14.4 $14.7 $14.8
$12.4 $12.5
$13.4 $13.3
$12.6
Q2 22
Q3 22
Q4 22
Q1 23
Q2 23
Q2 22
Q3 22
Q4 22
Q1 23
Q2 23
■Total revenue per employee
■Adjusted total revenue per employee (1)
FTE
Full-time equivalent
Noninterest income/total revenue
■Adjusted Noninterest Income, excluding securities gain (loss)/adjusted total revenue(1)
(1) Non-GAAP measures that management believes aids in the discussion of results. See appendix for Non-GAAP reconciliation
Totals may not foot due to rounding NM not meaningful
Q2 22 Q3 22
Noninterest income per employee
Q4 22
Q1 23
Q2 23
■Adjusted noninterest income, excluding securities gain (loss) per employee(1)
6View entire presentation