Pathward Financial Results Presentation Deck
Asset Quality
19
Nonperforming Assets ("NPAs")
($ in millions)
0.58%
$44.3
1Q22
1.16%
$43.2
0.56%
1Q22
$38.3
2Q22
INPAS
0.95%
Nonperforming Loans ("NPLs")
($ in millions)
$35.8
2Q22
0.40%
INPLs
$26.8
3Q22
Period Ended
0.71%
NPAS/ Total Assets
$26.6
3Q22
0.46%
Period Ended
$30.9
4Q22
0.82%
$29.2
4Q22
NPLs/Total Loans
Pathward Financial, Inc. (Nasdaq: CASH) | Quarterly Investor Presentation
0.68%
$45.0
1Q23
1.16%
$40.9
1Q23
●
•
●
Adjusted Net Charge-Offs ("NCOS")¹
Excludes Tax Services NCOs and Related Seasonal Average Loans
($ in millions)
●
0.48%
$3.4
1Q22
0.37%
0.68%
$11.4
2Q22
1.25%
0.71%
0.46%
$4.2
3Q22
KEY CREDIT METRICS
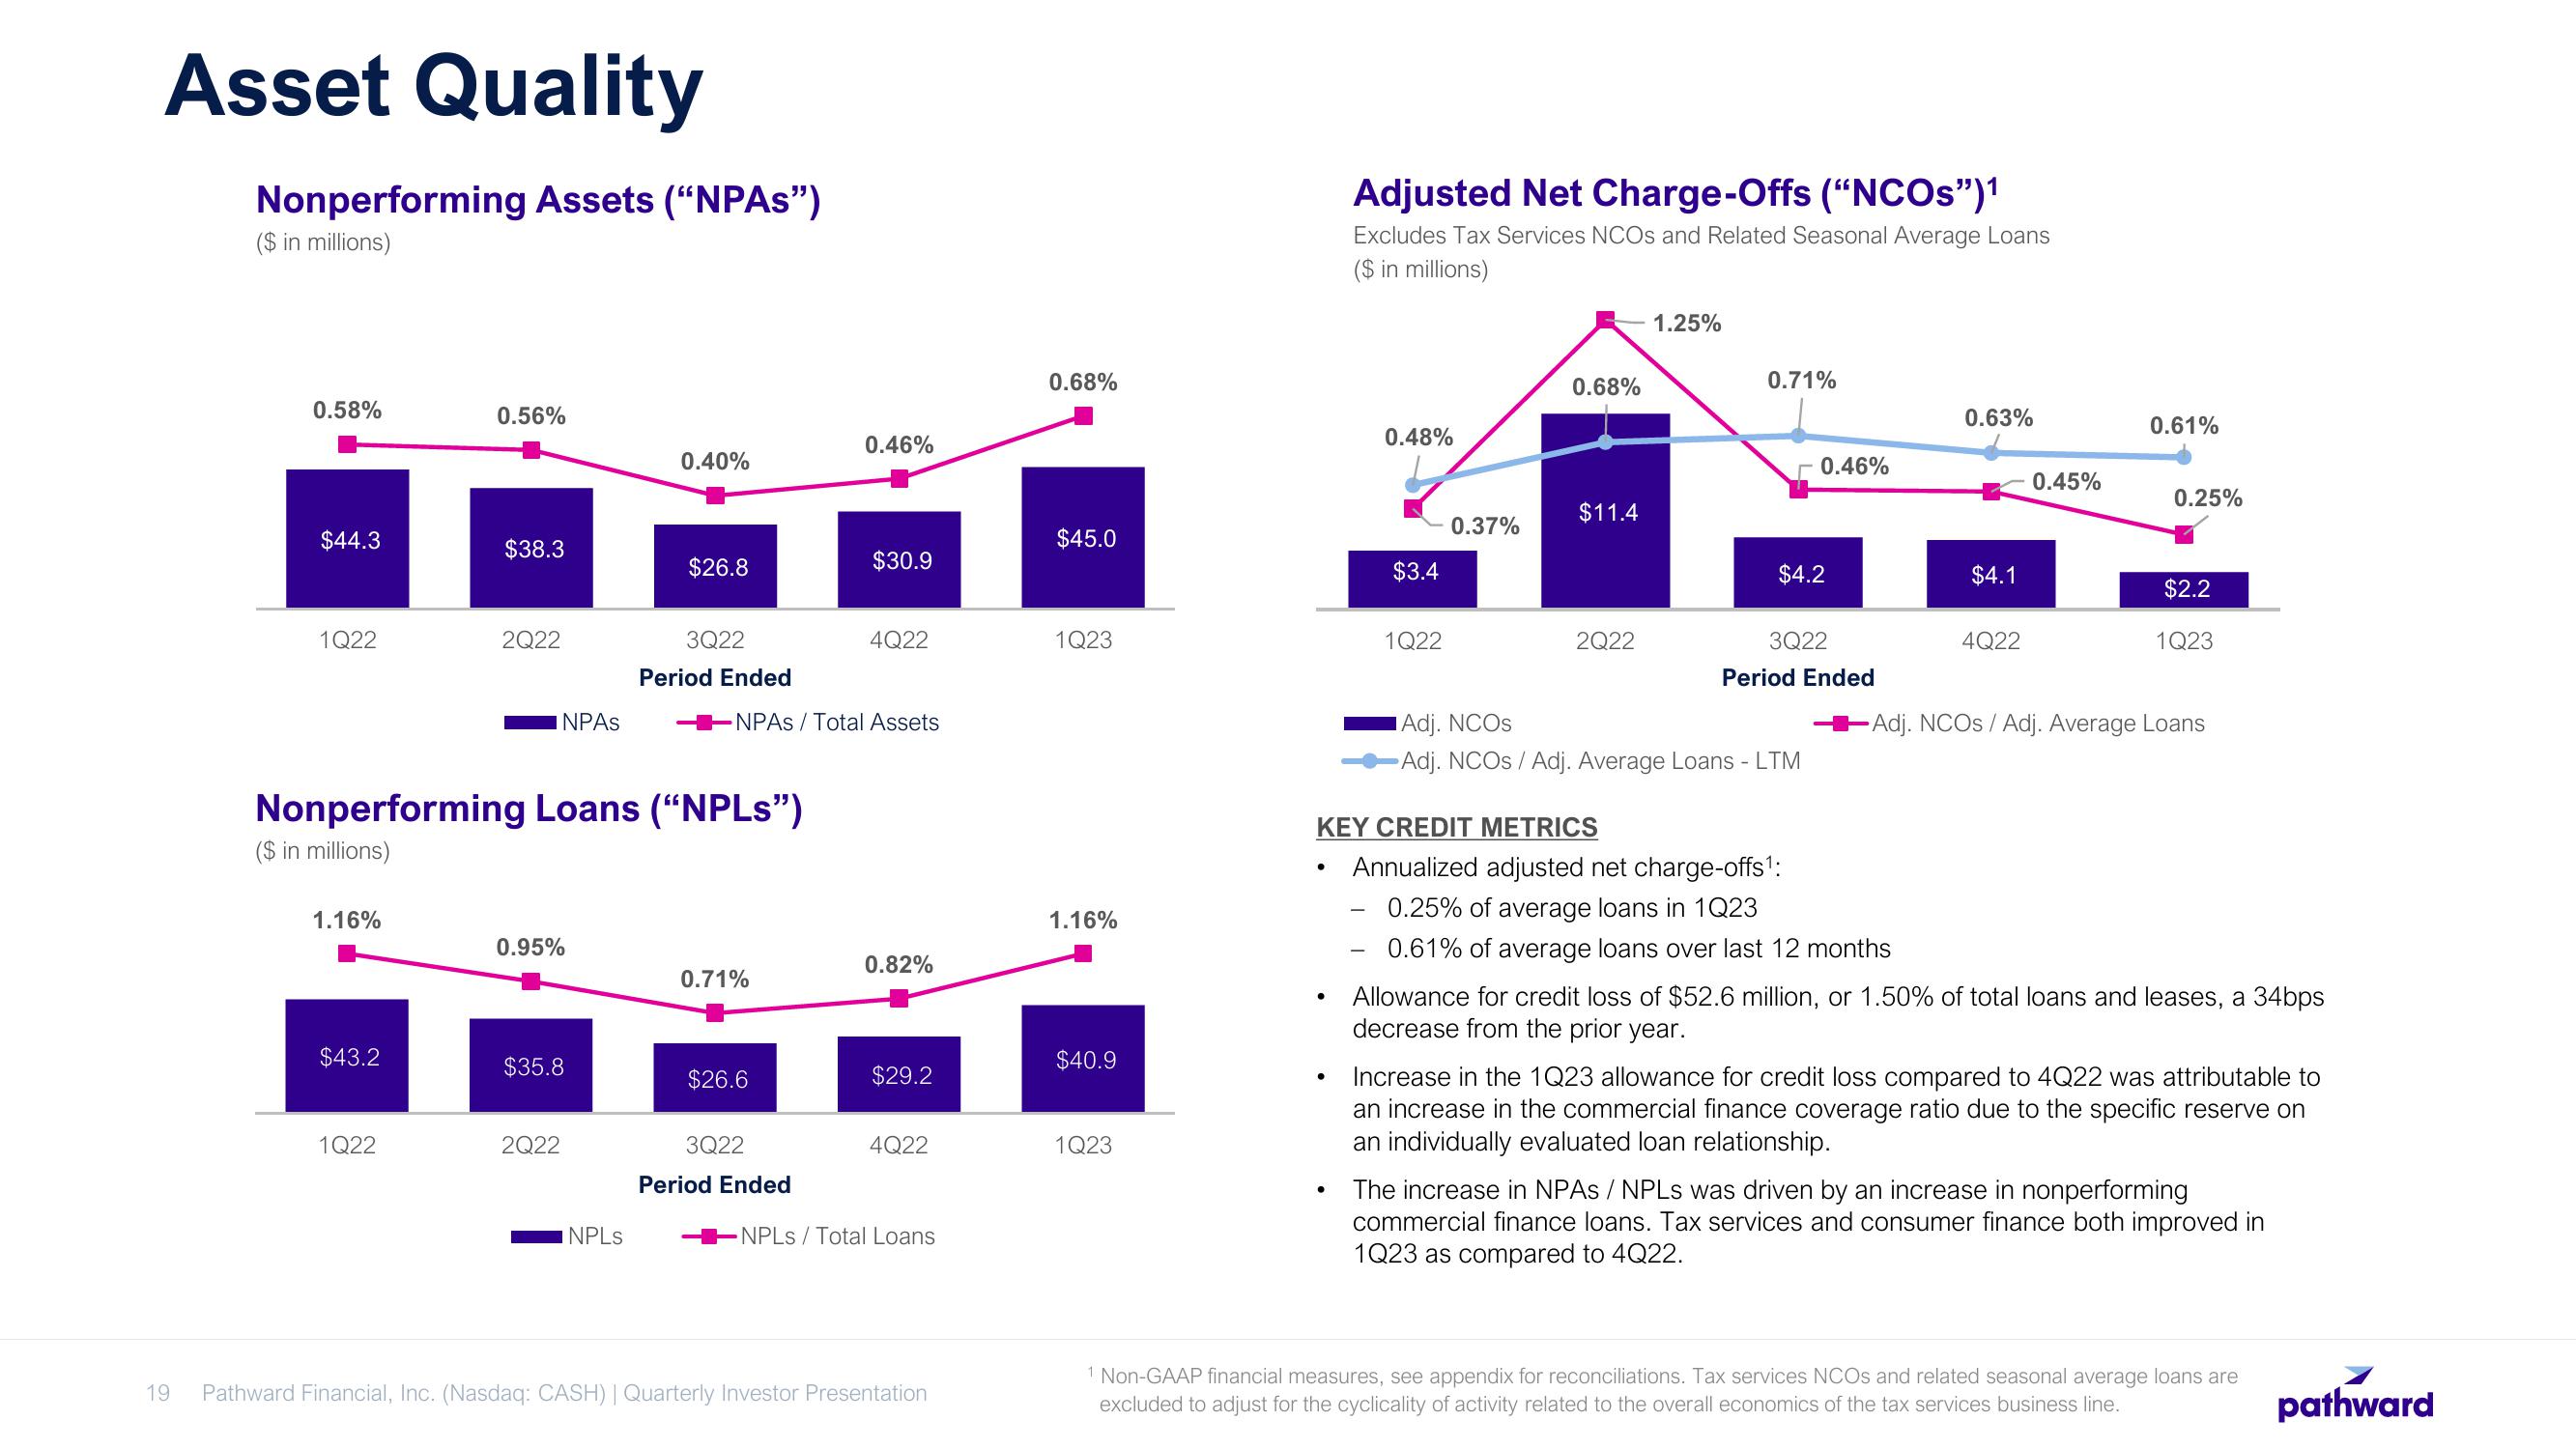
Annualized adjusted net charge-offs¹:
0.25% of average loans in 1Q23
0.61% of average loans over last 12 months
Period Ended
Adj. NCOS
-Adj. NCOS / Adj. Average Loans - LTM
0.63%
$4.1
4Q22
0.45%
0.61%
0.25%
$2.2
1Q23
-Adj. NCOS / Adj. Average Loans
Allowance for credit loss of $52.6 million, or 1.50% of total loans and leases, a 34bps
decrease from the prior year.
Increase in the 1Q23 allowance for credit loss compared to 4Q22 was attributable to
an increase in the commercial finance coverage ratio due to the specific reserve on
an individually evaluated loan relationship.
The increase in NPAs / NPLs was driven by an increase in nonperforming
commercial finance loans. Tax services and consumer finance both improved in
1Q23 as compared to 4Q22.
1 Non-GAAP financial measures, see appendix for reconciliations. Tax services NCOS and related seasonal average loans are
excluded to adjust for the cyclicality of activity related to the overall economics of the tax services business line.
pathwardView entire presentation