Atalaya Risk Management Overview
Track Record: AIF Funds
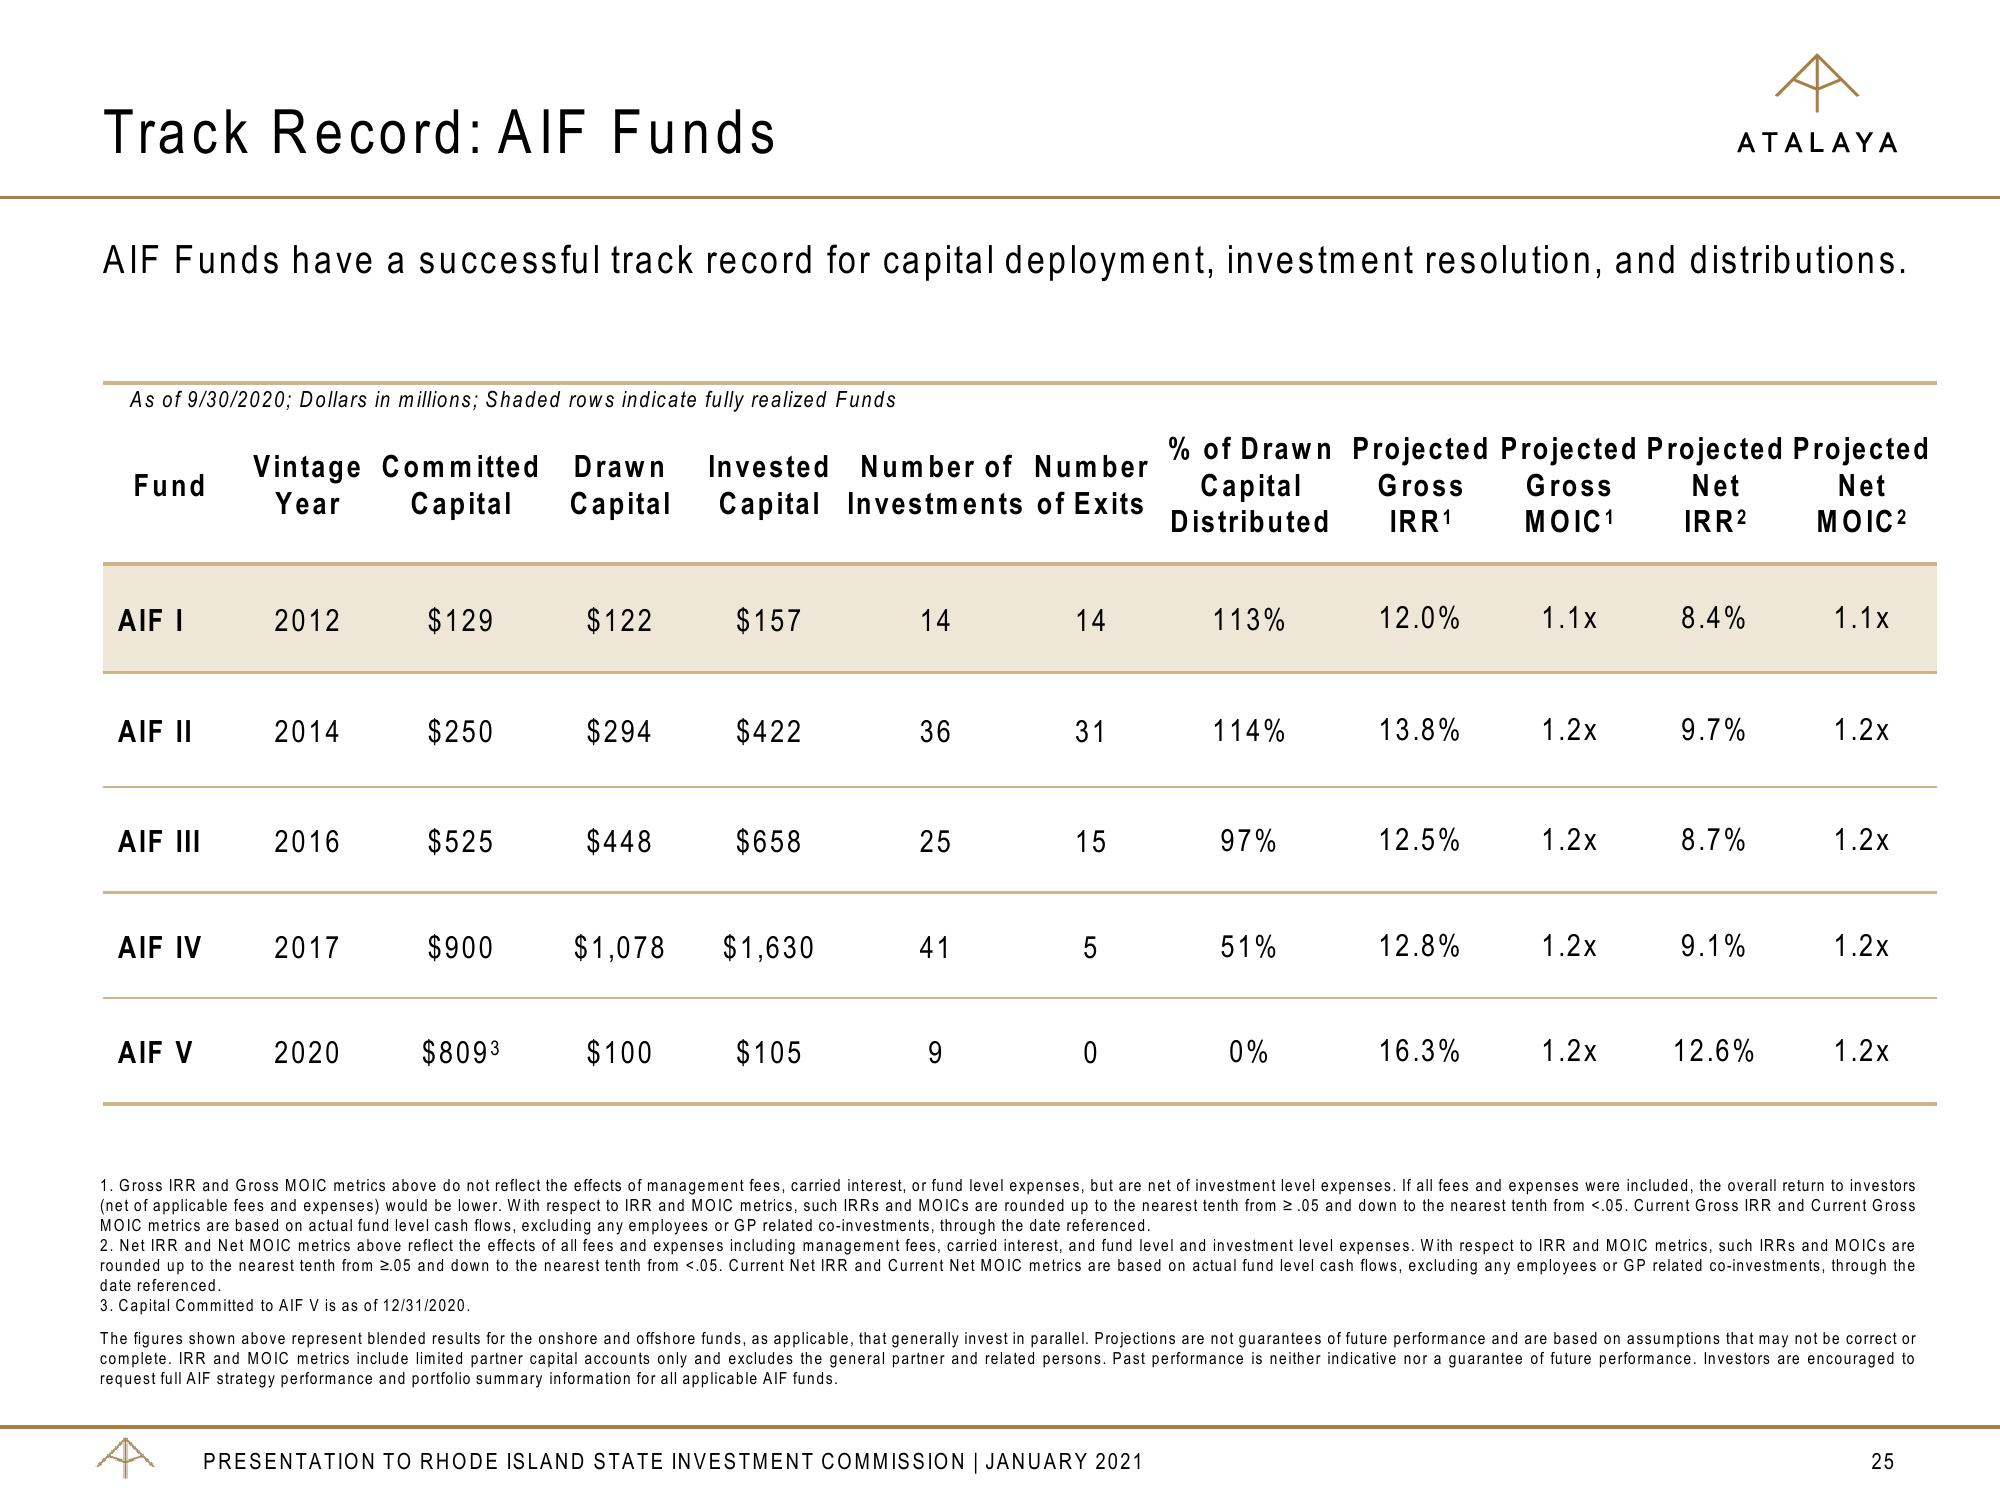
AIF Funds have a successful track record for capital deployment, investment resolution, and distributions.
As of 9/30/2020; Dollars in millions; Shaded rows indicate fully realized Funds
Fund
AIF I
AIF II
AIF III
AIF IV
AIF V
Vintage Committed Drawn Invested Number of Number
Year Capital Capital Capital Investments of Exits
2012
2014
2016
2017
2020
$129
$250
$525
$900
$8093
$122
$294
$448
$157
$100
$422
$658
$1,078 $1,630
$105
14
36
25
41
9
14
31
15
5
0
% of Drawn Projected Projected Projected Projected
Capital Gross Gross
IRR ¹
Net
Net
Distributed
MOIC1
IRR²
MOIC²
113%
PRESENTATION TO RHODE ISLAND STATE INVESTMENT COMMISSION | JANUARY 2021
114%
97%
51%
0%
12.0%
13.8%
12.5%
12.8%
16.3%
1.1x
1.2x
1.2x
ATALAYA
1.2x
1.2x
8.4%
9.7%
8.7%
9.1%
12.6%
1.1x
1.2x
1.2x
1.2x
1.2x
1. Gross IRR and Gross MOIC metrics above do not reflect the effects of management fees, carried interest, or fund level expenses, but are net of investment level expenses. If all fees and expenses were included, the overall return to investors.
(net of applicable fees and expenses) would be lower. With respect to IRR and MOIC metrics, such IRRs and MOICs are rounded up to the nearest tenth from 2.05 and down to the nearest tenth from <.05. Current Gross IRR and Current Gross
MOIC metrics are based on actual fund level cash flows, excluding any employees or GP related co-investments, through the date referenced.
2. Net IRR and Net MOIC metrics above reflect the effects of all fees and expenses including management fees, carried interest, and fund level and investment level expenses. With respect to IRR and MOIC metrics, such IRRS and MOICs are
rounded up to the nearest tenth from 2.05 and down to the nearest tenth from <.05. Current Net IRR and Current Net MOIC metrics are based on actual fund level cash flows, excluding any employees or GP related co-investments, through the
date referenced.
3. Capital Committed to AIF V is as of 12/31/2020.
The figures shown above represent blended results for the onshore and offshore funds, as applicable, that generally invest in parallel. Projections are not guarantees of future performance and are based on assumptions that may not be correct or
complete. IRR and MOIC metrics include limited partner capital accounts only and excludes the general partner and related persons. Past performance is neither indicative nor a guarantee of future performance. Investors are encouraged to
request full AIF strategy performance and portfolio summary information for all applicable AIF funds.
25View entire presentation