Bed Bath & Beyond Results Presentation Deck
FINANCIAL OUTLOOK
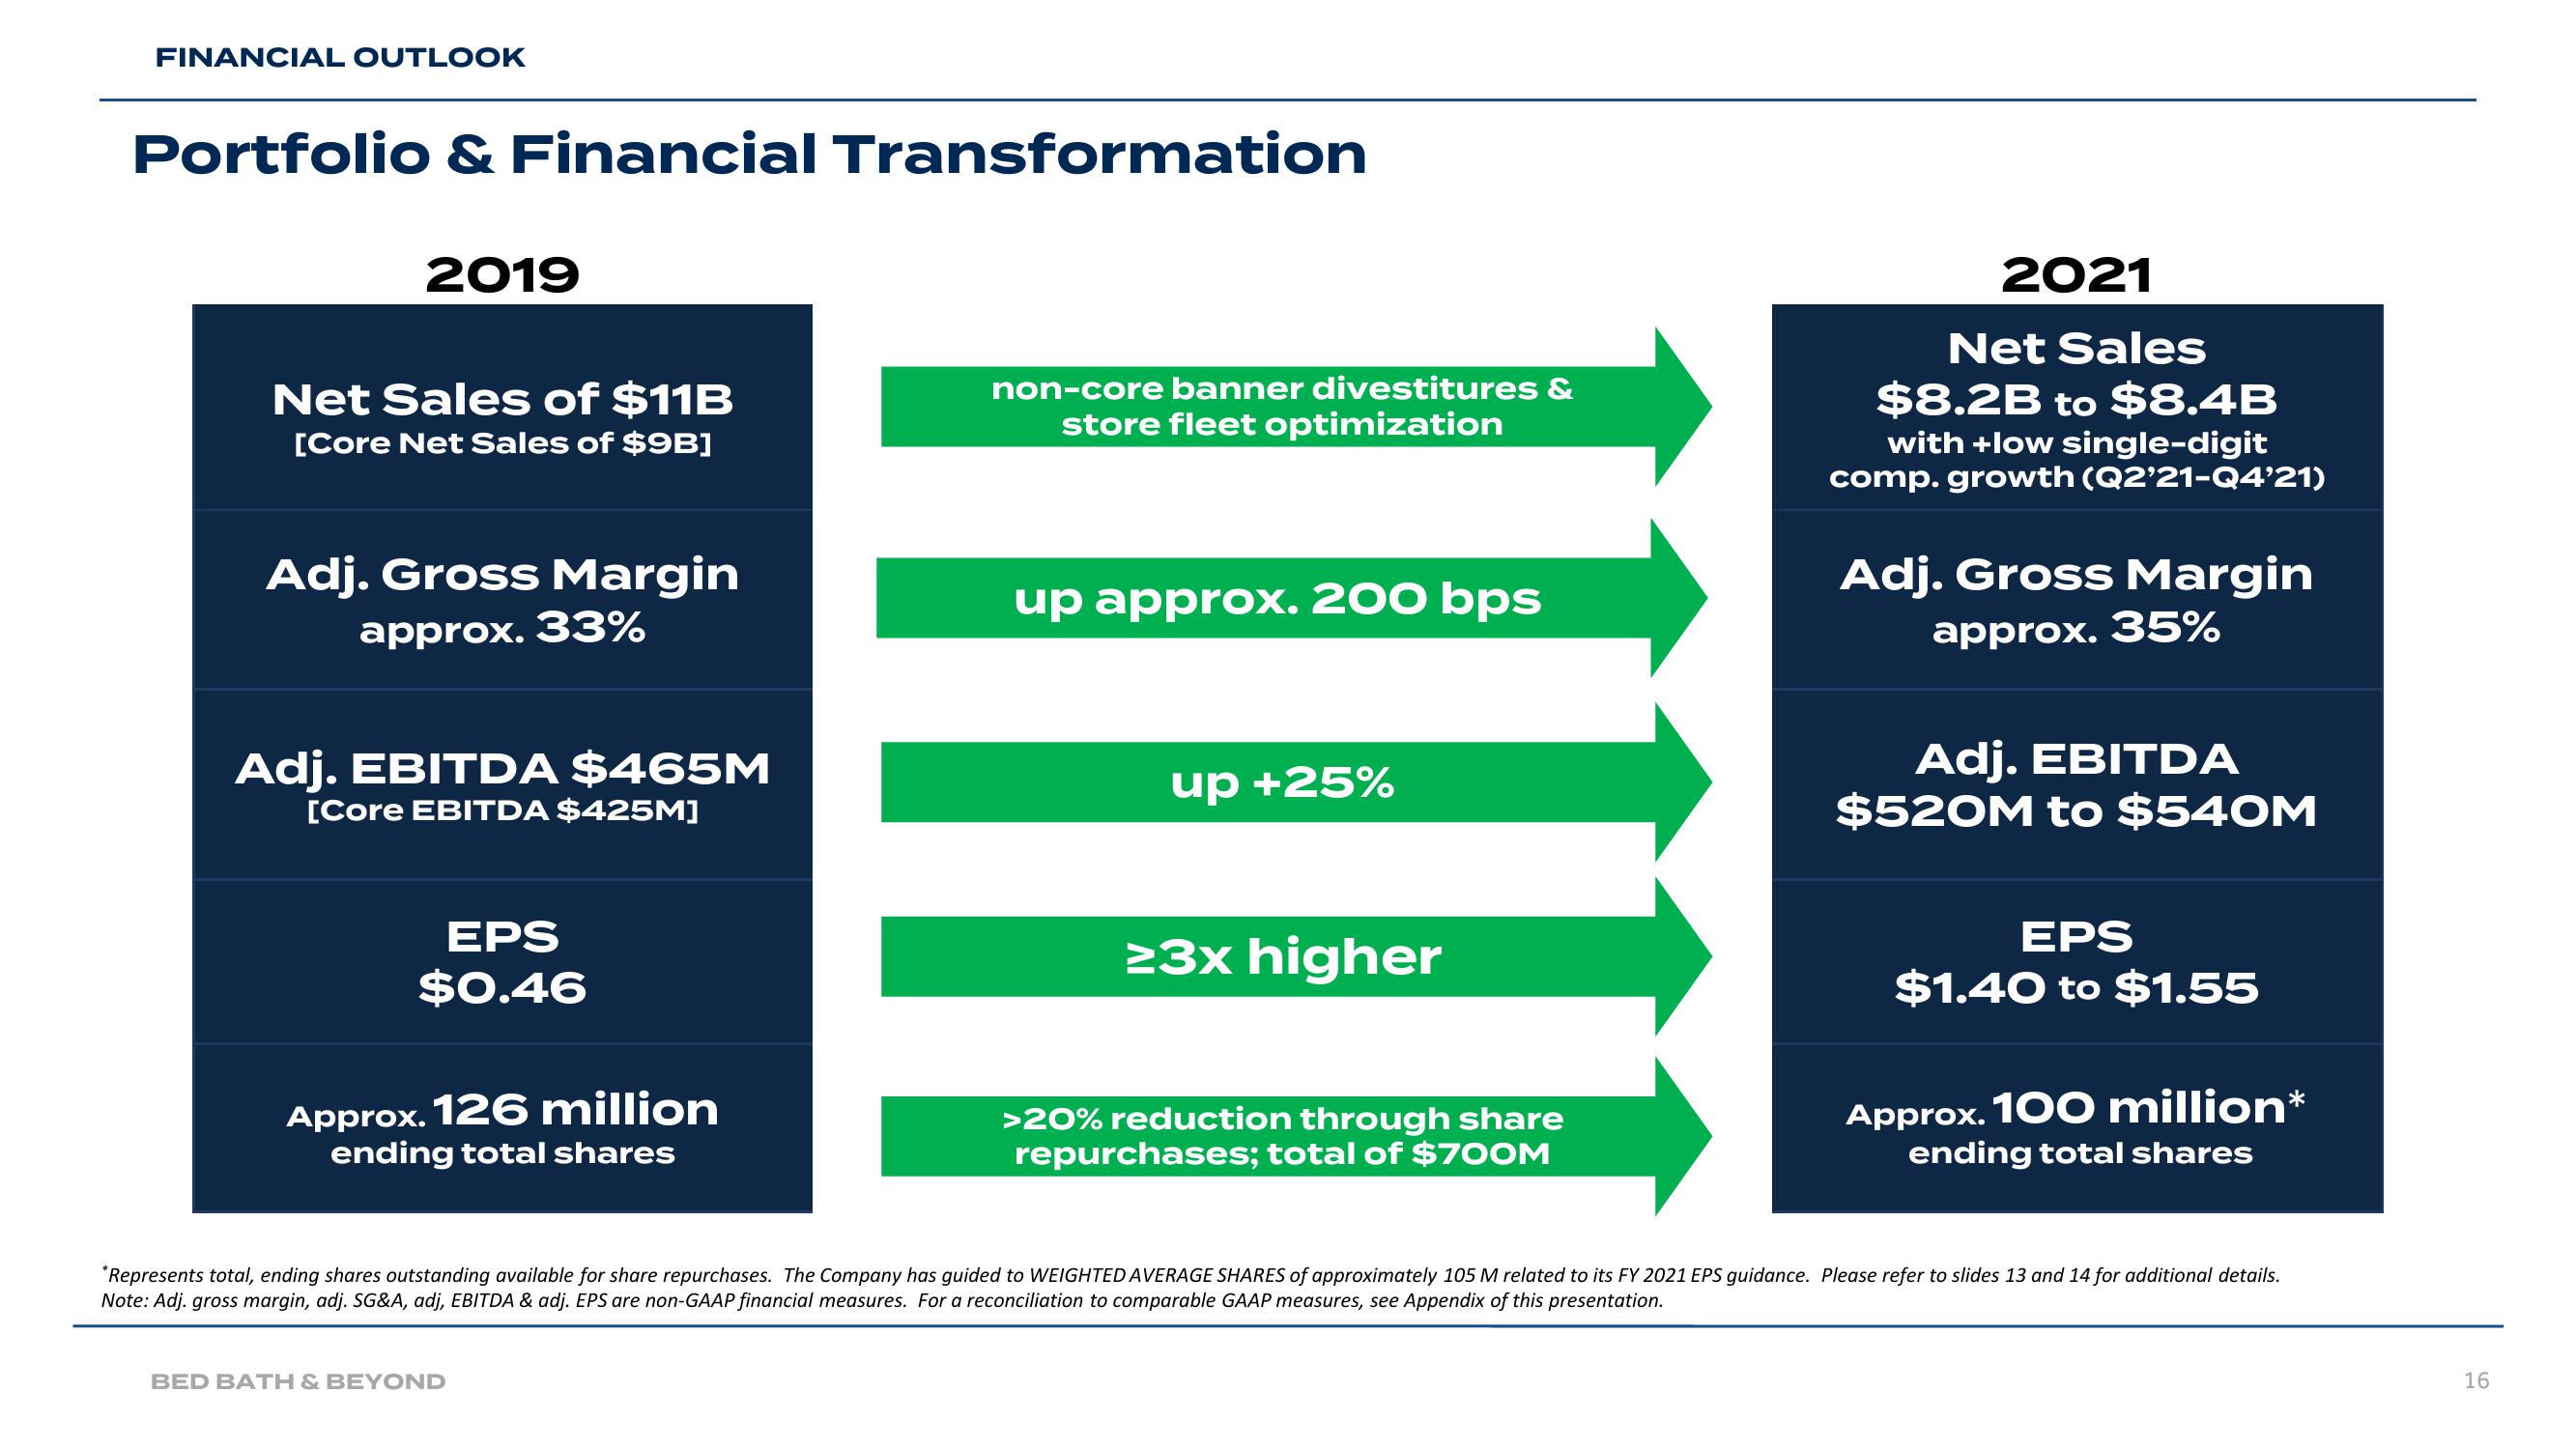
Portfolio & Financial Transformation
2019
Net Sales of $11B
[Core Net Sales of $9B]
Adj. Gross Margin
approx. 33%
Adj. EBITDA $465M
[Core EBITDA $425M]
EPS
$0.46
Approx. 126 million
ending total shares
non-core banner divestitures &
store fleet optimization
BED BATH & BEYOND
up approx. 200 bps
up +25%
>3x higher
>20% reduction through share
repurchases; total of $700M
2021
Net Sales
$8.2B to $8.4B
with +low single-digit
comp.growth (Q2'21-Q4'21)
Adj. Gross Margin
approx. 35%
Adj. EBITDA
$520M to $540M
EPS
$1.40 to $1.55
Approx. 100 million*
ending total shares
*Represents total, ending shares outstanding available for share repurchases. The Company has guided to WEIGHTED AVERAGE SHARES of approximately 105 M related to its FY 2021 EPS guidance. Please refer to slides 13 and 14 for additional details.
Note: Adj. gross margin, adj. SG&A, adj, EBITDA & adj. EPS are non-GAAP financial measures. For a reconciliation to comparable GAAP measures, see Appendix of this presentation.
16View entire presentation