Fort Capital Investment Banking Pitch Book
NPV Analysis - Mother Lode
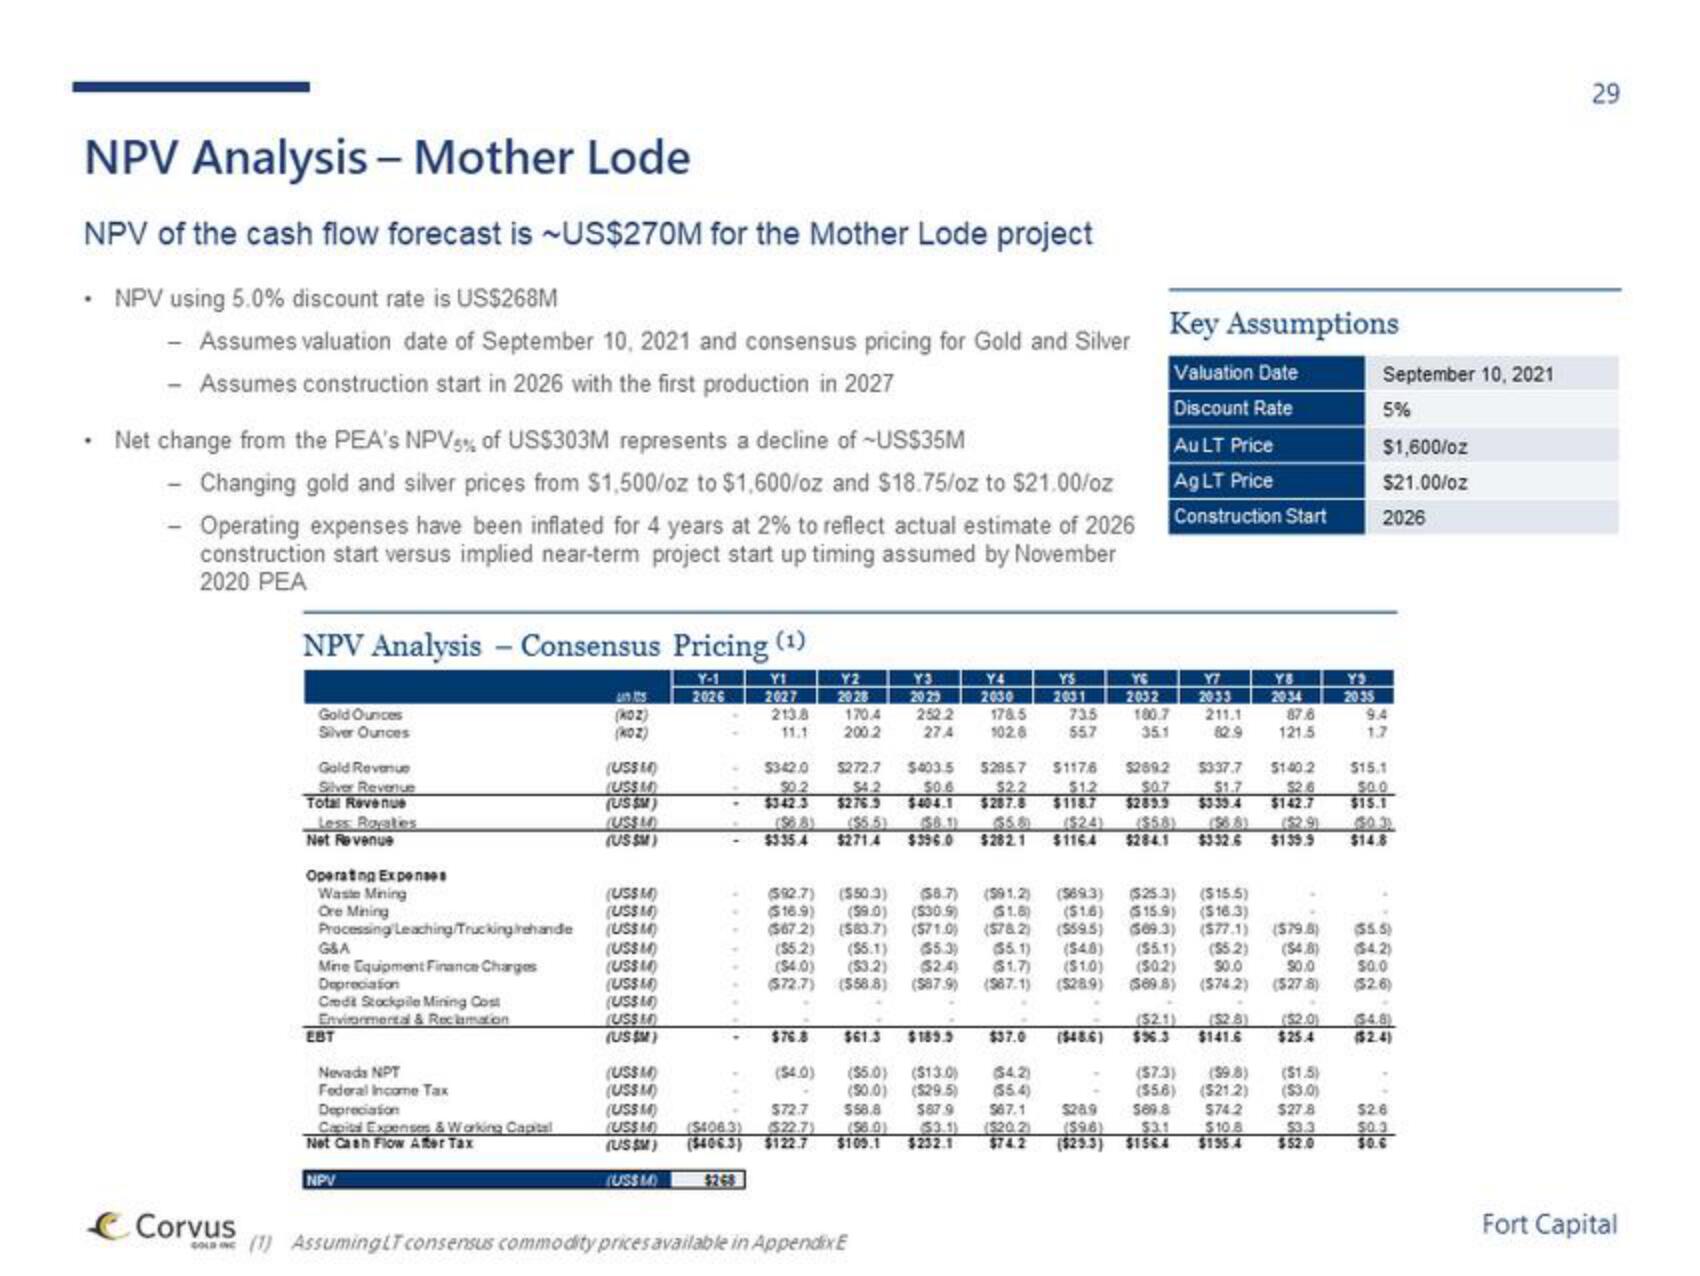
NPV of the cash flow forecast is ~US$270M for the Mother Lode project
• NPV using 5.0% discount rate is US$268M
- Assumes valuation date of September 10, 2021 and consensus pricing for Gold and Silver
Assumes construction start in 2026 with the first production in 2027
Net change from the PEA's NPV5% of US$303M represents a decline of US$35M
- Changing gold and silver prices from $1,500/oz to $1,600/oz and $18.75/oz to $21.00/oz
- Operating expenses have been inflated for 4 years at 2% to reflect actual estimate of 2026
construction start versus implied near-term project start up timing assumed by November
2020 PEA
Corvus
NPV Analysis - Consensus Pricing (1)
YI
2027
Gold Ounces
Silver Ounces
Gold Revenue
Silver Revenue
Total Revenue
Less Roates
Net Revenue
Operating Expenses
Waste Mining
Ore Mining
Processing Leaching/Truckingrehande
G&A
Mine Equipment Finance Charges
Depreciation
Credit Stockpile Mining Cost
Environmental & Reclamation
ЕВТ
Nevads NPT
Federal Income Tax
Depreciation
Capital Expenses & Working Capital
Net Cash Flow After Tax
NPV
(KOZ)
(KOZ)
(USS)
(USSM)
(USSM)
(USSLO)
(USSM)
(USSM)
(USS 16)
(USSM)
(US$M)
(US$ 14)
(US$ 14)
(USS)
(USS)
(US$M)
(USSM)
(USSM)
2026
213.8
Y2
2028
$335.4
170.4
200.2
178.5
102.8
$342.0 $272.7 $403.5 52857
$1176 $289.2
$0.2
$4.2 $0.6 $2.2 $1.2 $0.7
$342.3 $276.3 $404.1 $287.8 $118.7
$289.3
($5.5)
(524) (558)
$271.4 $396.0
$76.8 $61.3
($5.0)
(50.0)
Y3
20 29
(USSM)
$72.7 $58.8
(USSM) ($4063) ($22.7) (56.0)
(US$M)
(USSM)
252.2
27 A
(1) AssumingLT consensus commodity prices available in Appendix E
Y4
2030
YS
2031
$122.7 $109.1 $232.1
735
557
YC
2032
Key Assumptions
Valuation Date
Discount Rate
Au LT Price
Ag LT Price
Construction Start
$189.3 $37.0 ($48.6)
($13.0)
($29.5)
$87.9
180.7
35.1
Y7
2033
211.1
$337.7
$1.7
(592.7) ($50.3) (58.7) (991.2) (569.3) ($25.3) ($15.5)
($16.9) (59.0) ($30.9) $1.8)
($1.6) ($15.9) ($16.3)
($67.2) ($83.7) ($71.0) ($78.2) ($59.5) (509.3) ($77.1) ($79.8)
($5.2) (55.1) (65.3) (55.1) (548) ($5.1) (55.2) (54.8)
($4.0) (53.2) $2.4) ($1.7) ($1.0) (502) 50.0 90.0
(572.7) (558.8) (587.9) (987.1) ($28.9) (589.8) ($74.2) (527.8)
YS
2034
87.6
121.5
$140.2
$142.7
$282.1 $116.4 $284.1 $3.32.6 $135.9
($2.1) ($2.8) ($2.0)
$56.3 $141.6 $25.4
(57.3) (39.8)
($1.5)
($5.6) ($21.2)
($3.0)
64.2)
(55.4)
567.1 $28.9 589.8 $74.2 $27.8
($20.2) (596) $3.1
$74.2 ($29.3) $1564 $195.4
$10.8
$3.3
$52.0
YS
2035
September 10, 2021
5%
$1,600/oz
$21.00/oz
2026
1.7
$15.1
$0.0
$15.1
$14.8
($5.5)
($4.2)
$0.0
($2.6)
(54.8)
($2.4)
$2.6
$0.3
$0.6
29
Fort CapitalView entire presentation