J.P.Morgan Software Investment Banking
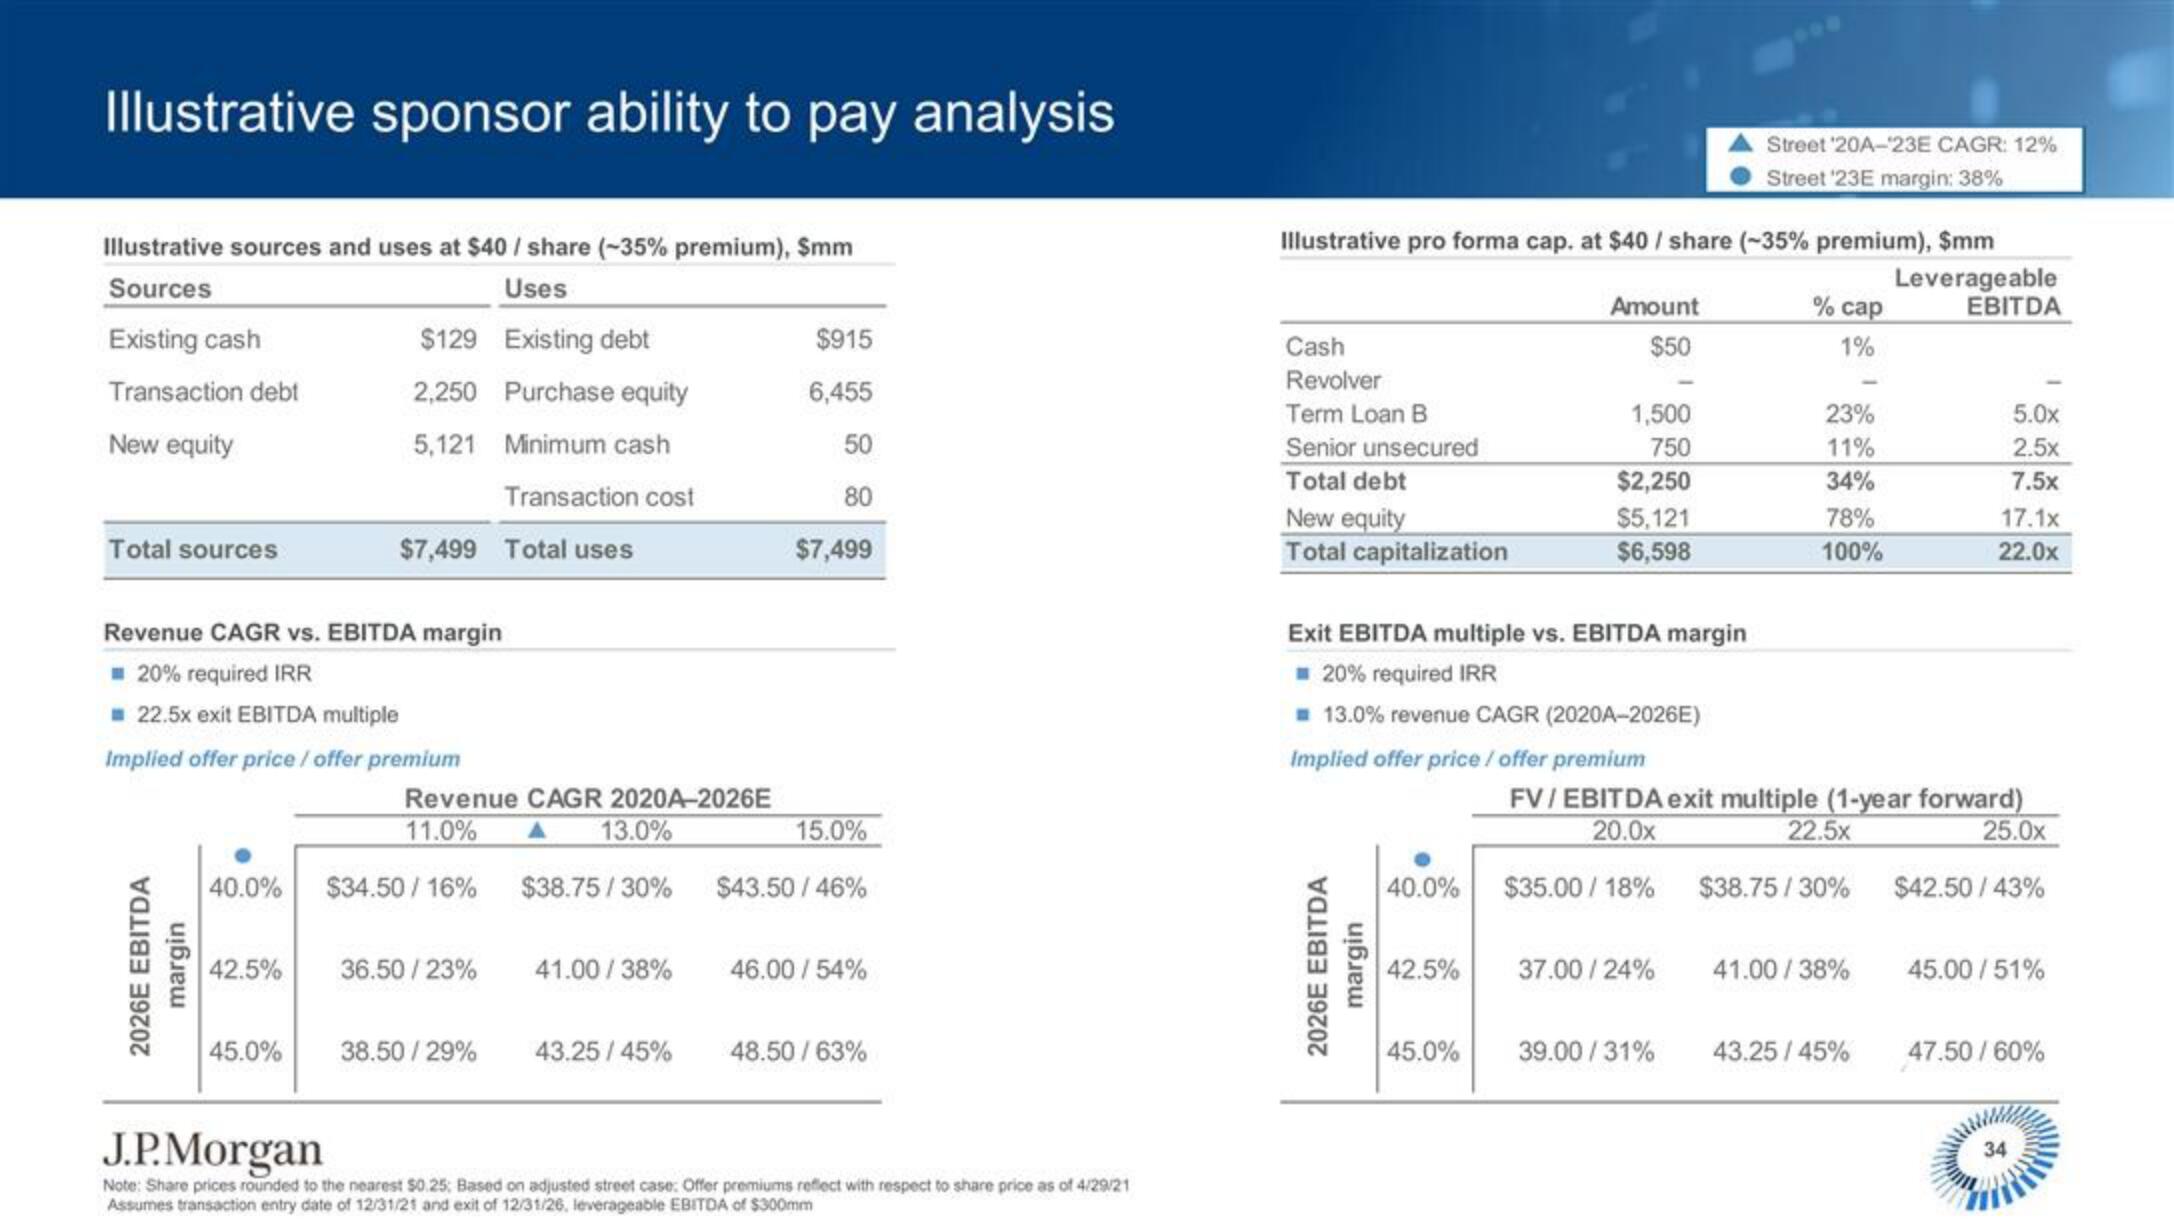
Illustrative sponsor ability to pay analysis
Illustrative sources and uses at $40 / share (-35% premium), Smm
Sources
Uses
Existing cash
Existing debt
Transaction debt
Purchase equity
New equity
Minimum cash
Transaction cost
Total sources
$129
2,250
5,121
2026E EBITDA
margin
$7,499 Total uses
Revenue CAGR vs. EBITDA margin
20% required IRR
☐ 22.5x exit EBITDA multiple
Implied offer price / offer premium
Revenue CAGR 2020A-2026E
11.0% ▲ 13.0%
40.0% $34.50 / 16%
42.5% 36.50/23%
45.0% 38.50/29%
$915
6,455
50
80
$7,499
15.0%
$38.75/30% $43.50 / 46%
43.25/45%
41.00/38% 46.00/54%
48.50 / 63%
J.P.Morgan
Note: Share prices rounded to the nearest $0.25; Based on adjusted street case: Offer premiums reflect with respect to share price as of 4/29/21
Assumes transaction entry date of 12/31/21 and exit of 12/31/26, leverageable EBITDA of $300mm
Illustrative pro forma cap. at $40 / share (-35% premium), $mm
Leverageable
EBITDA
Cash
Revolver
Term Loan B
Senior unsecured
Total debt
New equity
Total capitalization
2026E EBITDA
margin
Exit EBITDA multiple vs. EBITDA margin
☐ 20% required IRR
☐ 13.0% revenue CAGR (2020A-2026E)
40.0%
Amount
$50
Implied offer price / offer premium
42.5%
1,500
750
45.0%
$2,250
$5,121
$6,598
Street '20A-23E CAGR: 12%
Street '23E margin: 38%
37.00/24%
39.00/31%
% cap
1%
23%
11%
34%
78%
100%
FV/EBITDA exit multiple (1-year forward)
20.0x
22.5x
25.0x
$35.00/ 18%
41.00/38%
5.0x
2.5x
7.5x
17.1x
22.0x
$38.75/30% $42.50/43%
43.25/45%
45.00/51%
47.50/60%
34View entire presentation