Kering Investor Presentation Deck slide image

Kering Investor Presentation Deck

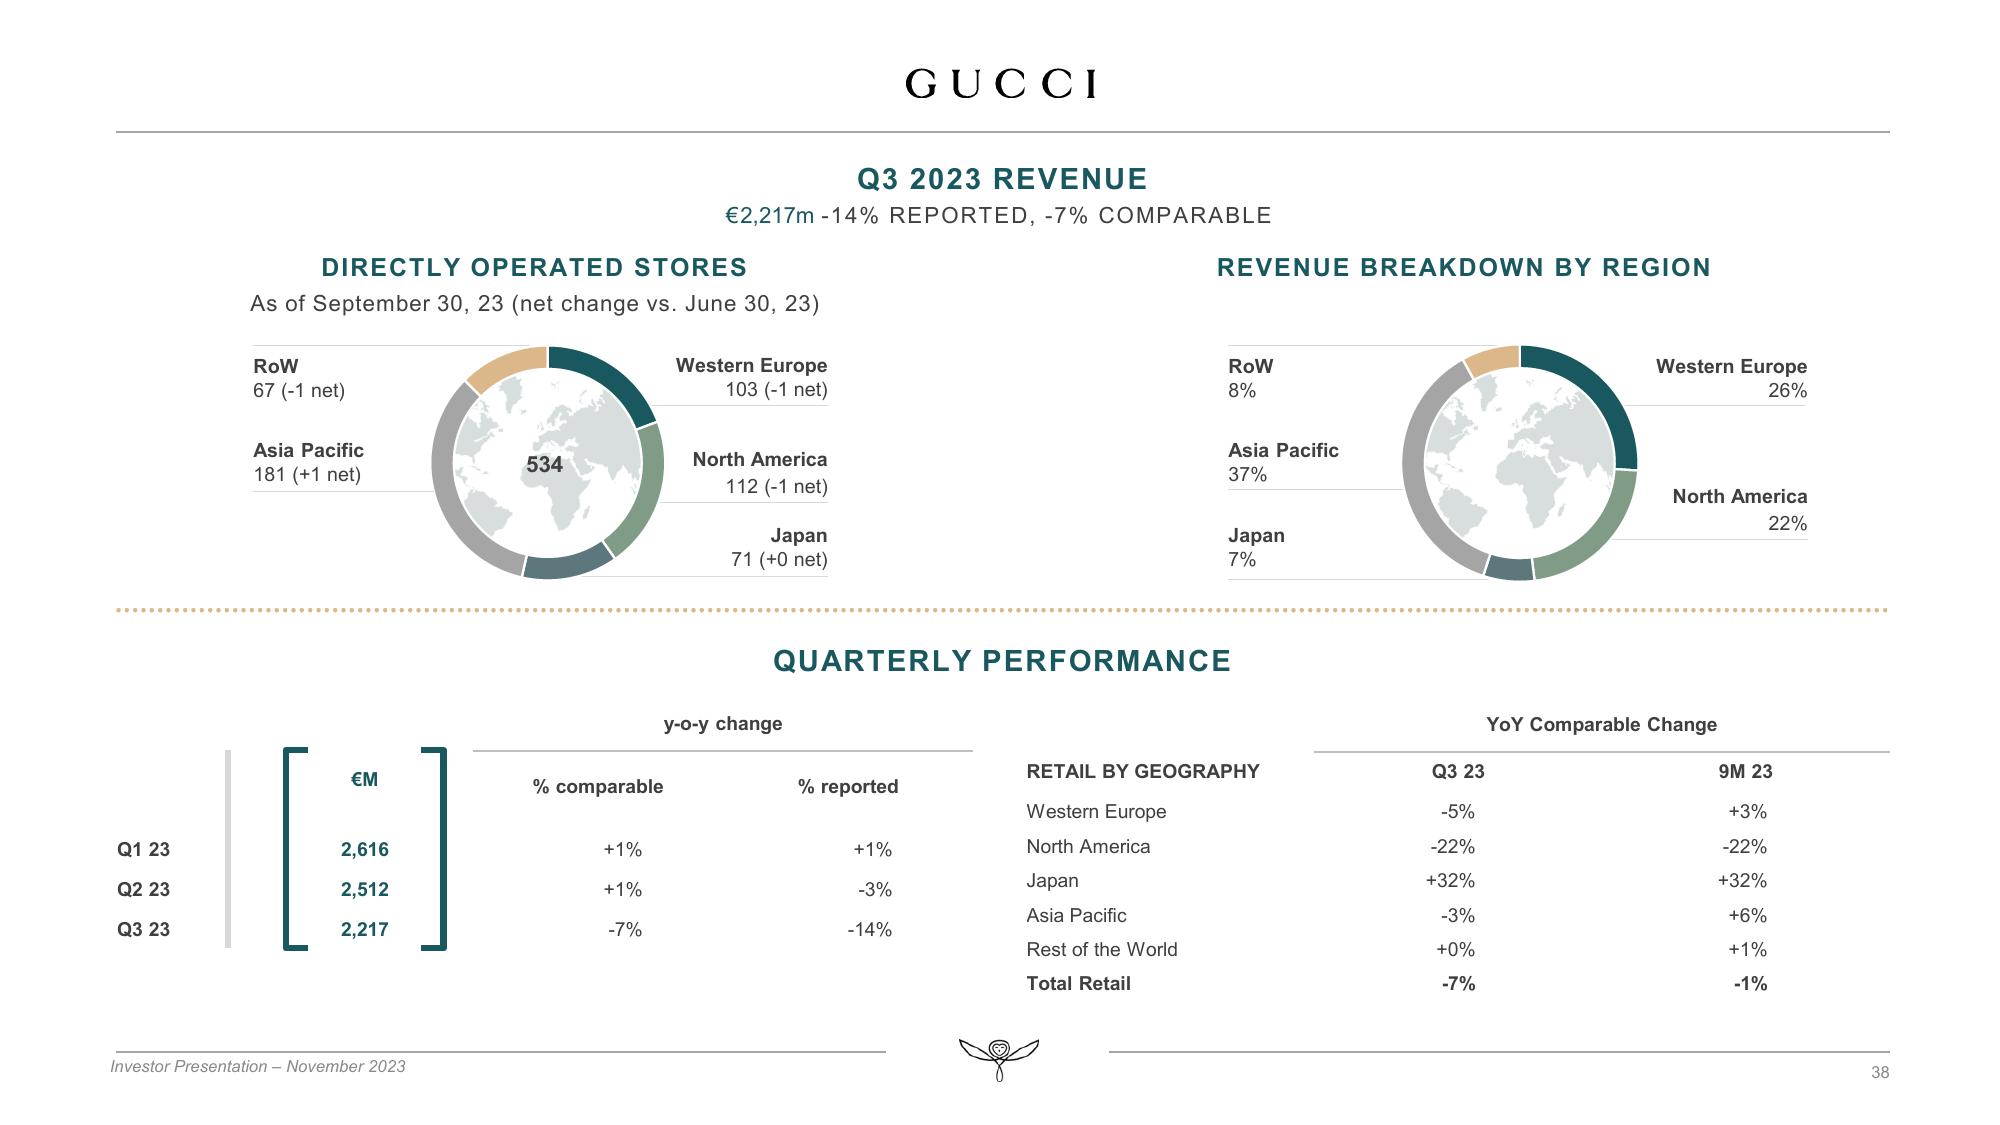
Q1 23 Q2 23 Q3 23 DIRECTLY OPERATED STORES As of September 30, 23 (net change vs. June 30, 23) ROW 67 (-1 net) Asia Pacific 181 (+1 net) €M 2,616 2,512 2,217 Investor Presentation - November 2023 534 % comparable +1% +1% -7% Q3 2023 REVENUE €2,217m -14% REPORTED, -7% COMPARABLE Western Europe 103 (-1 net) North America 112 (-1 net) Japan 71 (+0 net) y-o-y change % reported GUCCI +1% -3% -14% REVENUE BREAKDOWN BY REGION QUARTERLY PERFORMANCE RoW 8% Asia Pacific 37% Japan 7% RETAIL BY GEOGRAPHY Western Europe North America Japan Asia Pacific Rest of the World Total Retail Q3 23 -5% -22% +32% -3% +0% -7% Western Europe 26% North America 22% YOY Comparable Change 9M 23 +3% -22% +32% +6% +1% -1% 38
View entire presentation