Hilltop Holdings Results Presentation Deck
PrimeLending - Q4 2023 Highlights
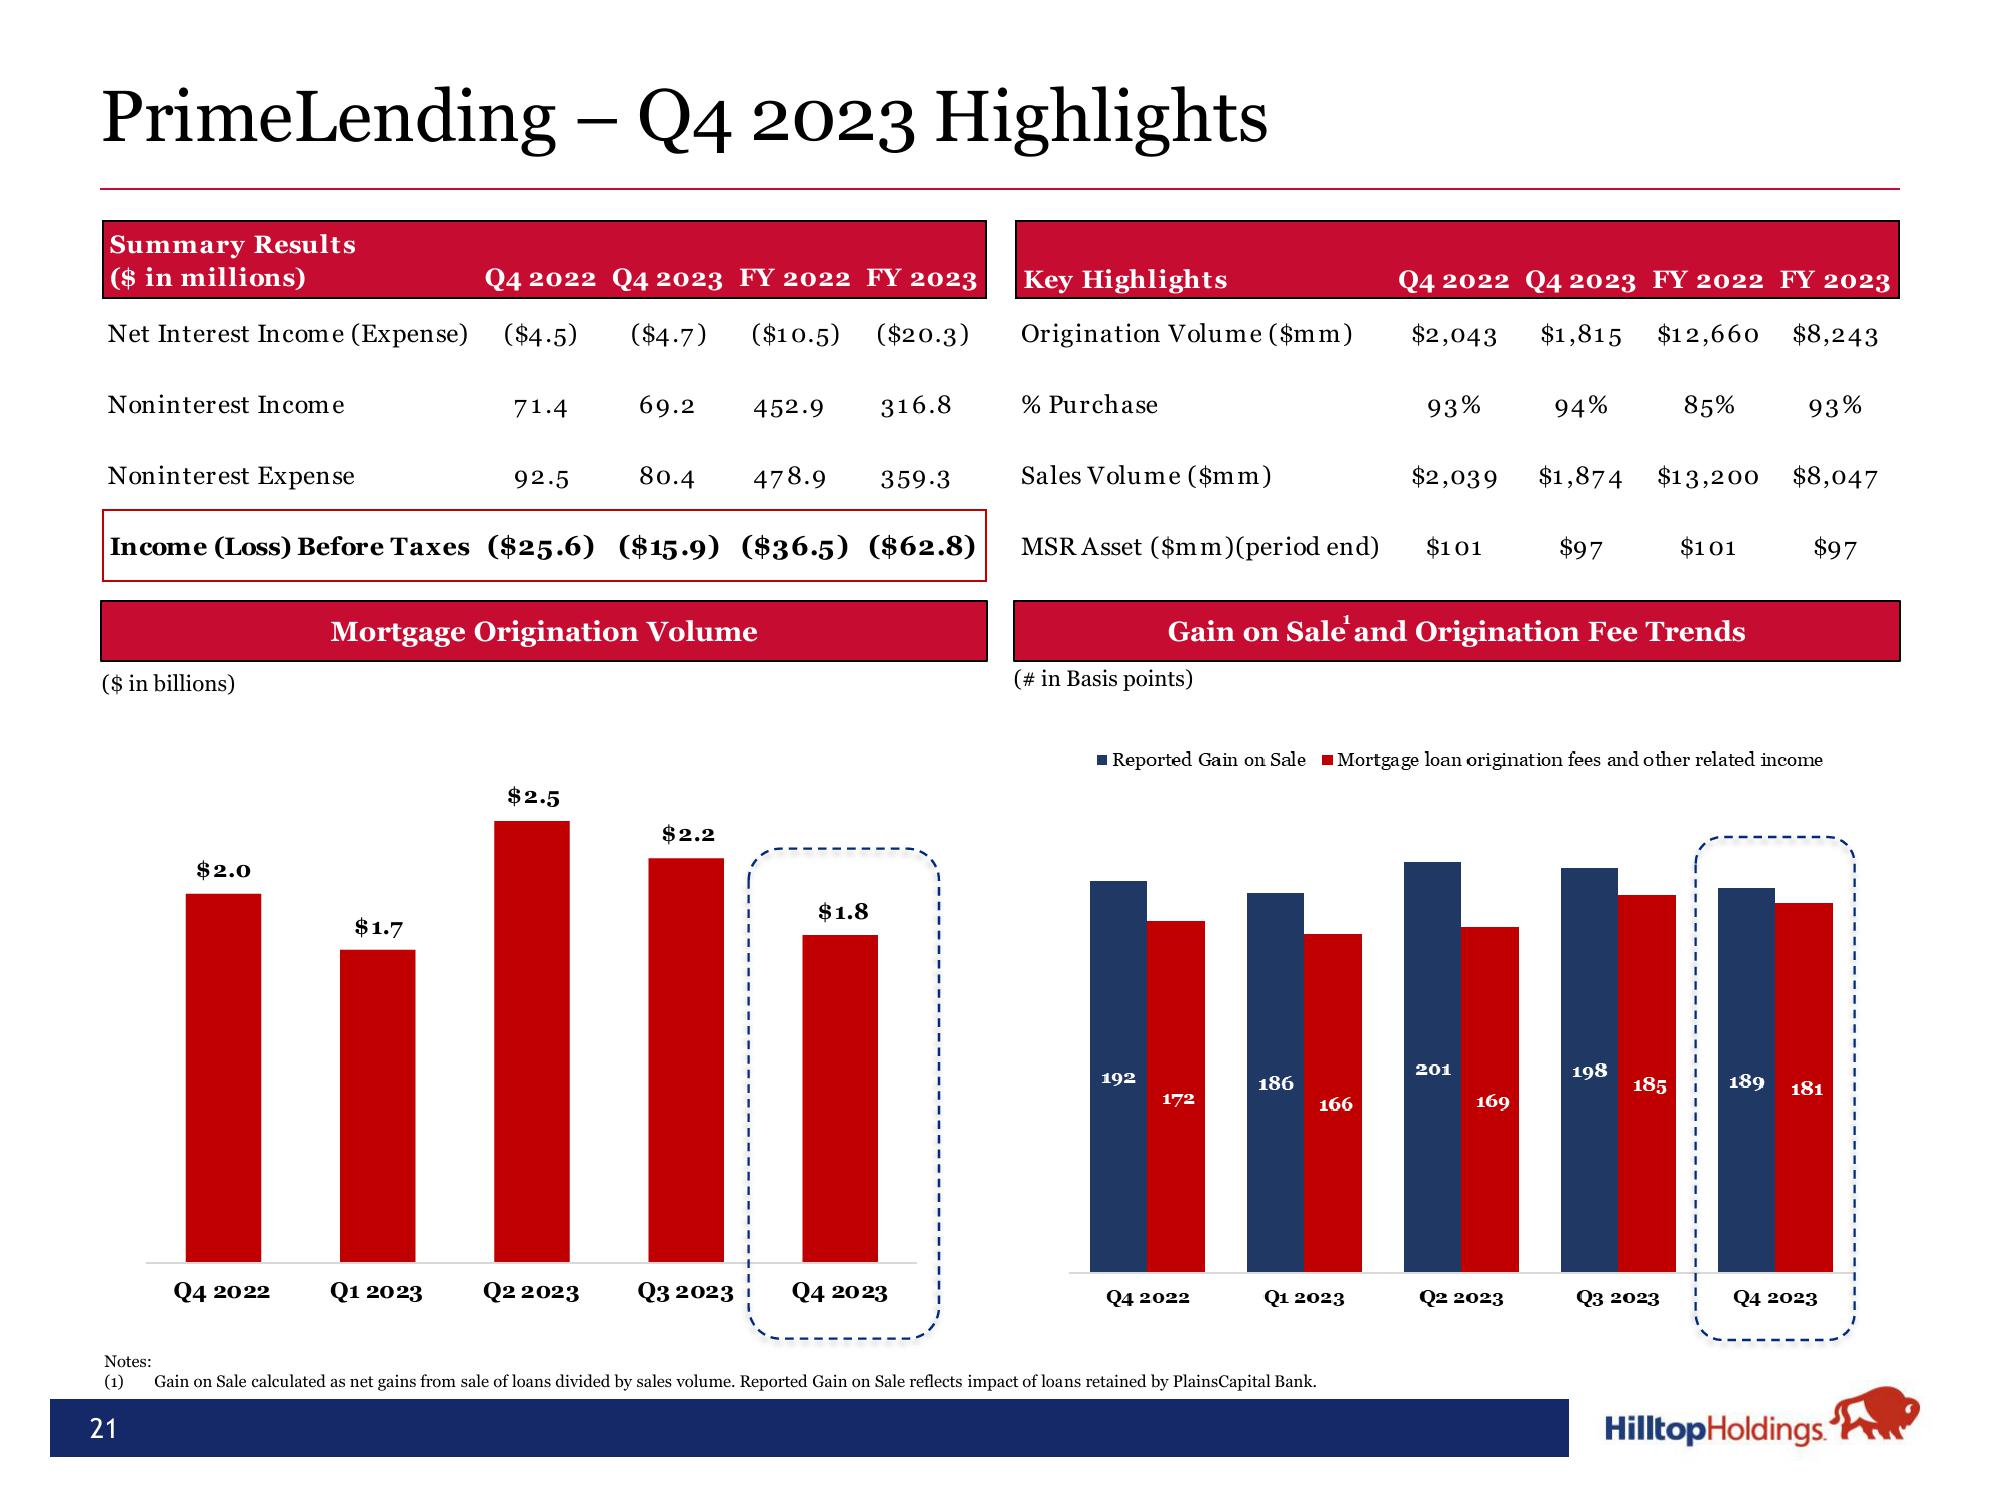
Summary Results
($ in millions)
Q4 2022 Q4 2023 FY 2022 FY 2023
Net Interest Income (Expense) ($4.5) ($4.7) ($10.5) ($20.3)
Noninterest Income
Noninterest Expense
($ in billions)
478.9 359.3
Income (Loss) Before Taxes ($25.6) ($15.9) ($36.5) ($62.8)
$2.0
$1.7
1₁
Q4 2022
71.4
Q1 2023
92.5
Mortgage Origination Volume
69.2 452.9
$2.5
80.4
Q2 2023
$2.2
Q3 2023
316.8
$1.8
Q4 2023
Key Highlights
Origination Volume ($mm)
% Purchase
(# in Basis points)
Sales Volume ($mm)
MSR Asset ($mm)(period end) $101
192
172
Q4 2022
186
Q4 2022 Q4 2023 FY 2022 FY 2023
$2,043 $1,815 $12,660 $8,243
93%
166
Q1 2023
Notes:
(1) Gain on Sale calculated as net gains from sale of loans divided by sales volume. Reported Gain on Sale reflects impact of loans retained by PlainsCapital Bank.
21
Gain on Sale' and Origination Fee Trends
$2,039 $1,874
Reported Gain on Sale Mortgage loan origination fees and other related income
94%
201
169
$97
Q2 2023
198
85%
$13,200 $8,047
185
$101
Q3 2023
93%
$97
189 181
Q4 2023
Hilltop Holdings.View entire presentation