Benson Hill Results Presentation Deck
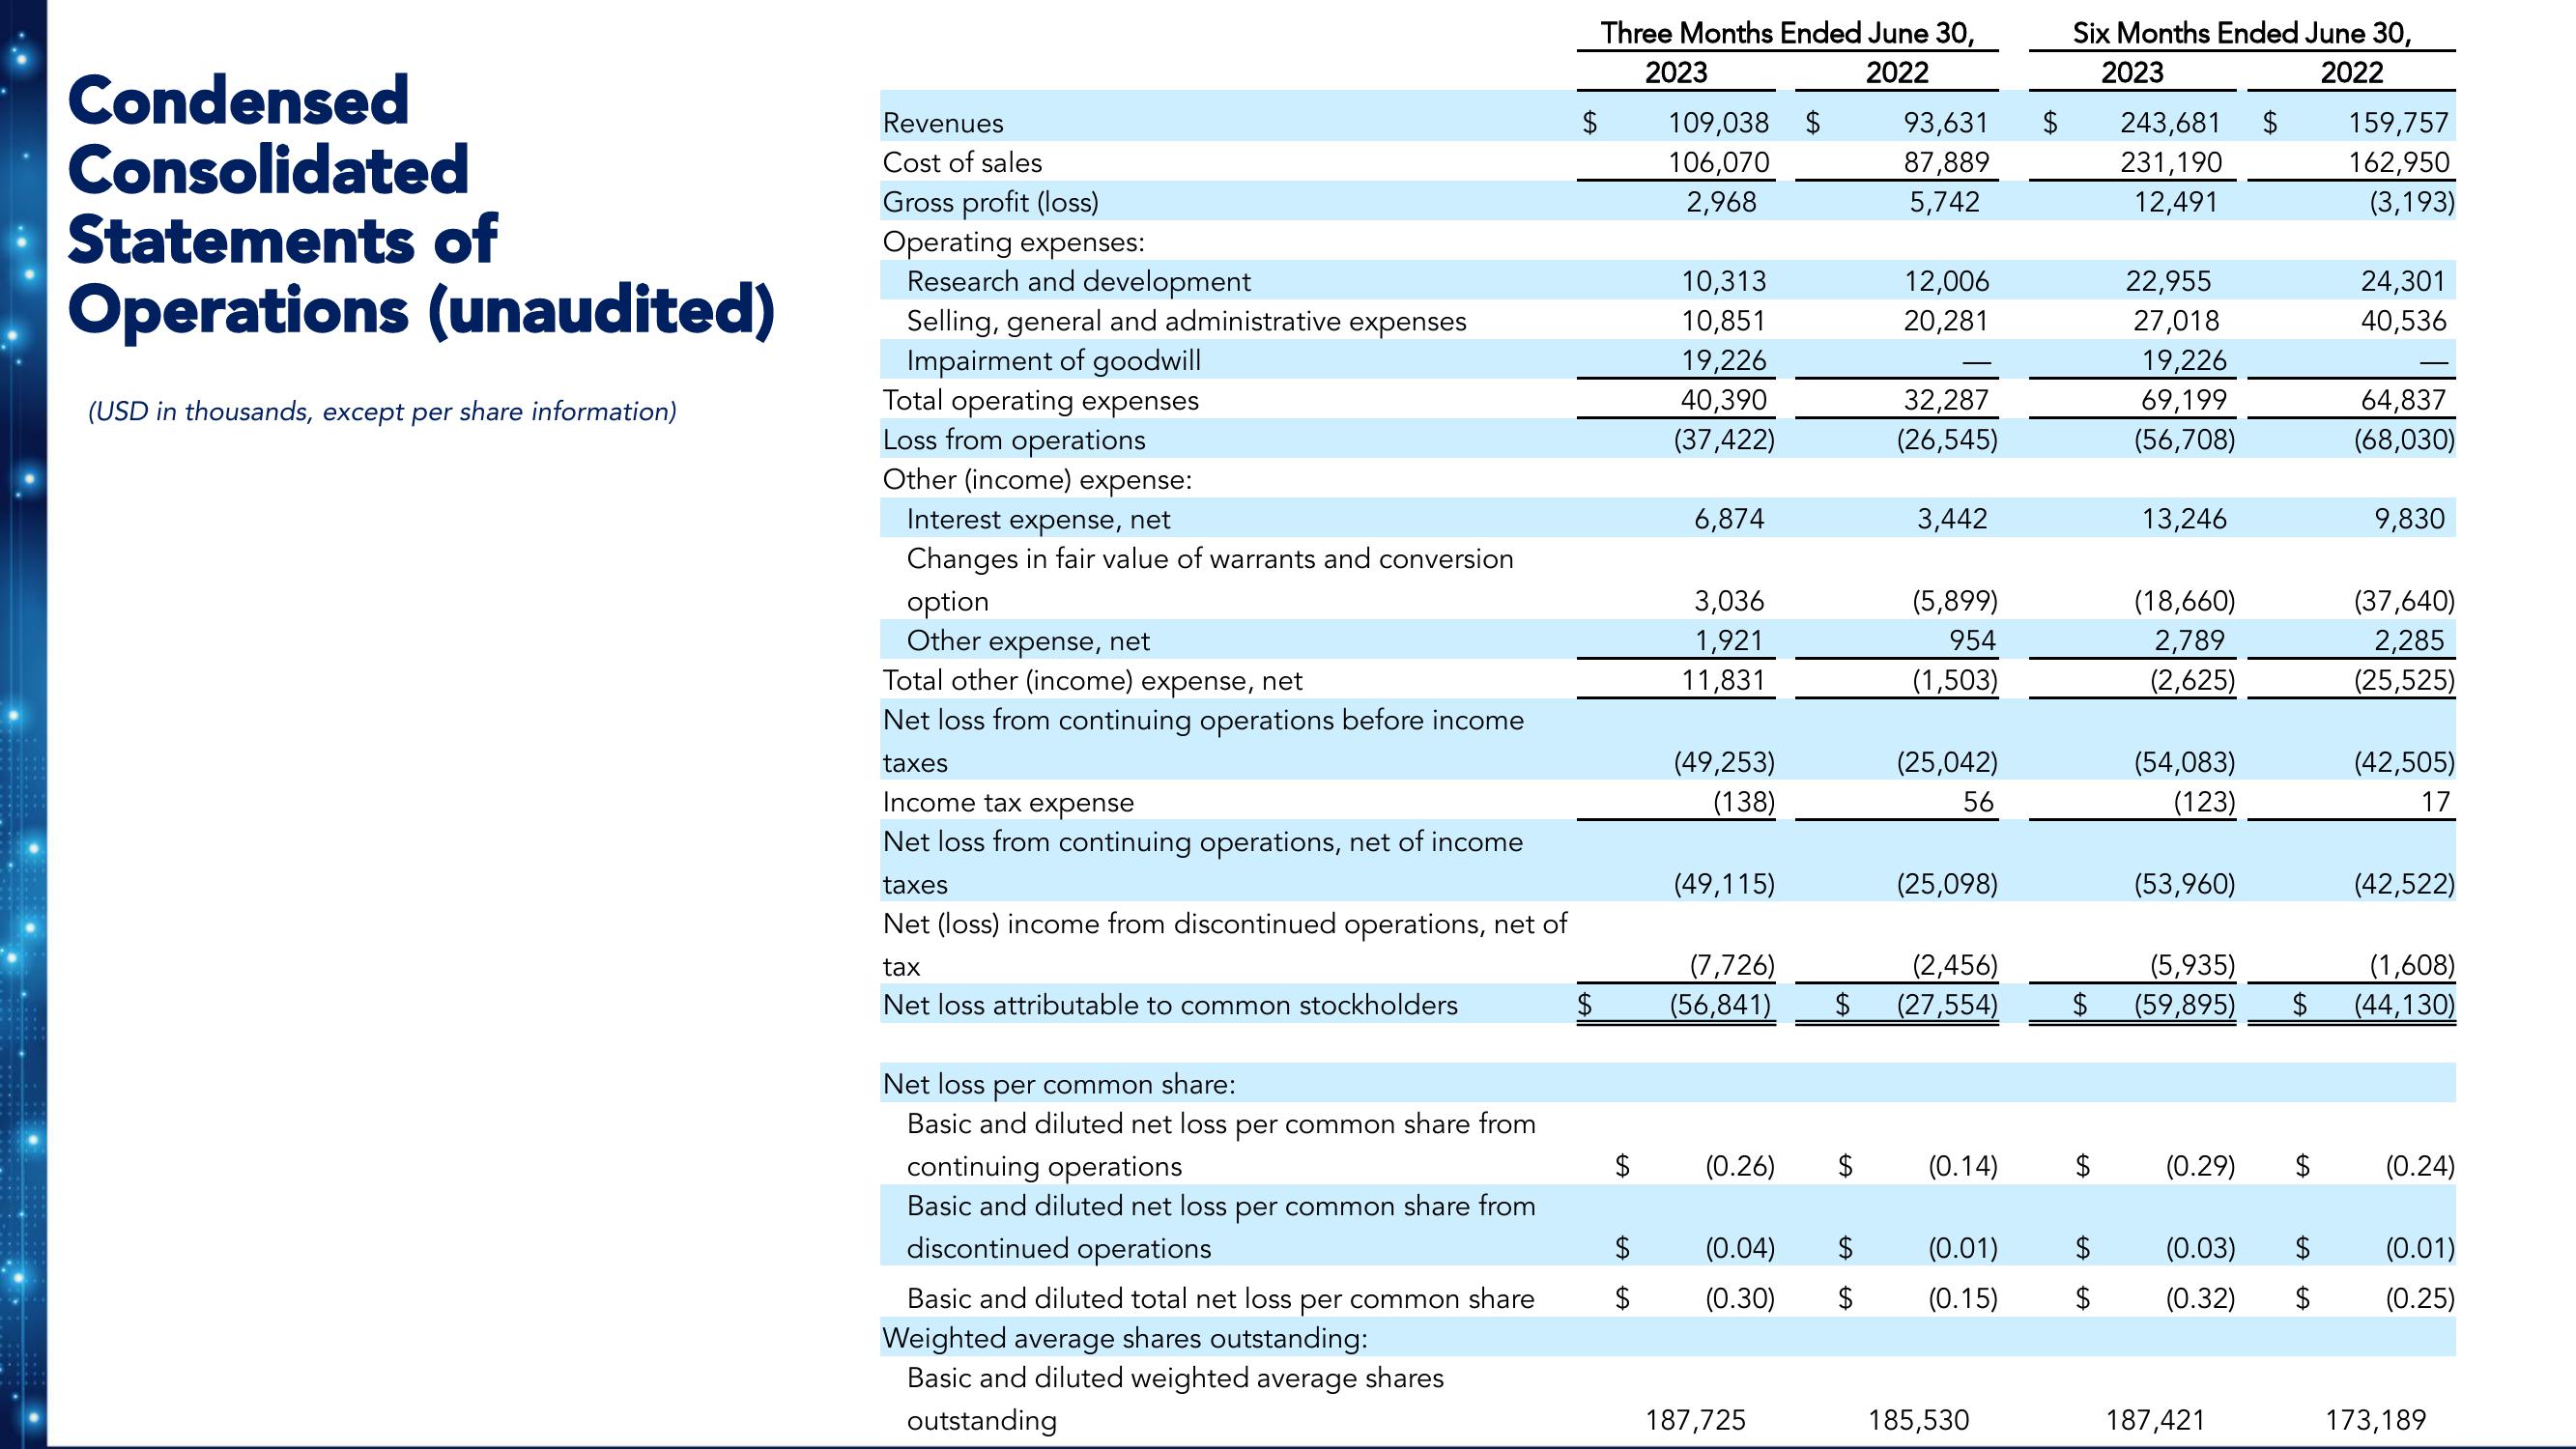
Condensed
Consolidated
Statements of
Operations (unaudited)
(USD in thousands, except per share information)
Revenues
Cost of sales
Gross profit (loss)
Operating expenses:
Research and development
Selling, general and administrative expenses
Impairment of goodwill
Total operating expenses
Loss from operations
Other (income) expense:
Interest expense, net
Changes in fair value of warrants and conversion
option
Other expense, net
Total other (income) expense, net
Net loss from continuing operations before income
taxes
Income tax expense
Net loss from continuing operations, net of income
taxes
Net (loss) income from discontinued operations, net of
tax
Net loss attributable to common stockholders
Net loss per common share:
Basic and diluted net loss per common share from
continuing operations
Basic and diluted net loss per common share from
discontinued operations
Basic and diluted total net loss per common share
Weighted average shares outstanding:
Basic and diluted weighted average shares
outstanding
$
$
Three Months Ended June 30,
2023
2022
$
$
109,038 $
106,070
2,968
10,313
10,851
19,226
40,390
(37,422)
6,874
3,036
1,921
11,831
(49,253)
(138)
(49,115)
(7,726)
(56,841)
(0.26)
(0.04)
(0.30)
187,725
93,631
87,889
5,742
$
12,006
20,281
32,287
(26,545)
3,442
(5,899)
954
(1,503)
(25,042)
56
(25,098)
(2,456)
$ (27,554)
(0.01)
(0.15)
$
185,530
Six Months Ended June 30,
2023
2022
(0.14) $
$
LA
$
243,681 $
231,190
12,491
22,955
27,018
19,226
69,199
(56,708)
13,246
(18,660)
2,789
(2,625)
(54,083)
(123)
(53,960)
(5,935)
(59,895)
(0.29)
(0.03)
(0.32)
187,421
$
159,757
162,950
(3,193)
$
24,301
40,536
64,837
(68,030)
9,830
(37,640)
2,285
(25,525)
(42,505)
17
(1,608)
$ (44,130)
(42,522)
(0.24)
(0.01)
(0.25)
173,189View entire presentation