Cboe Results Presentation Deck
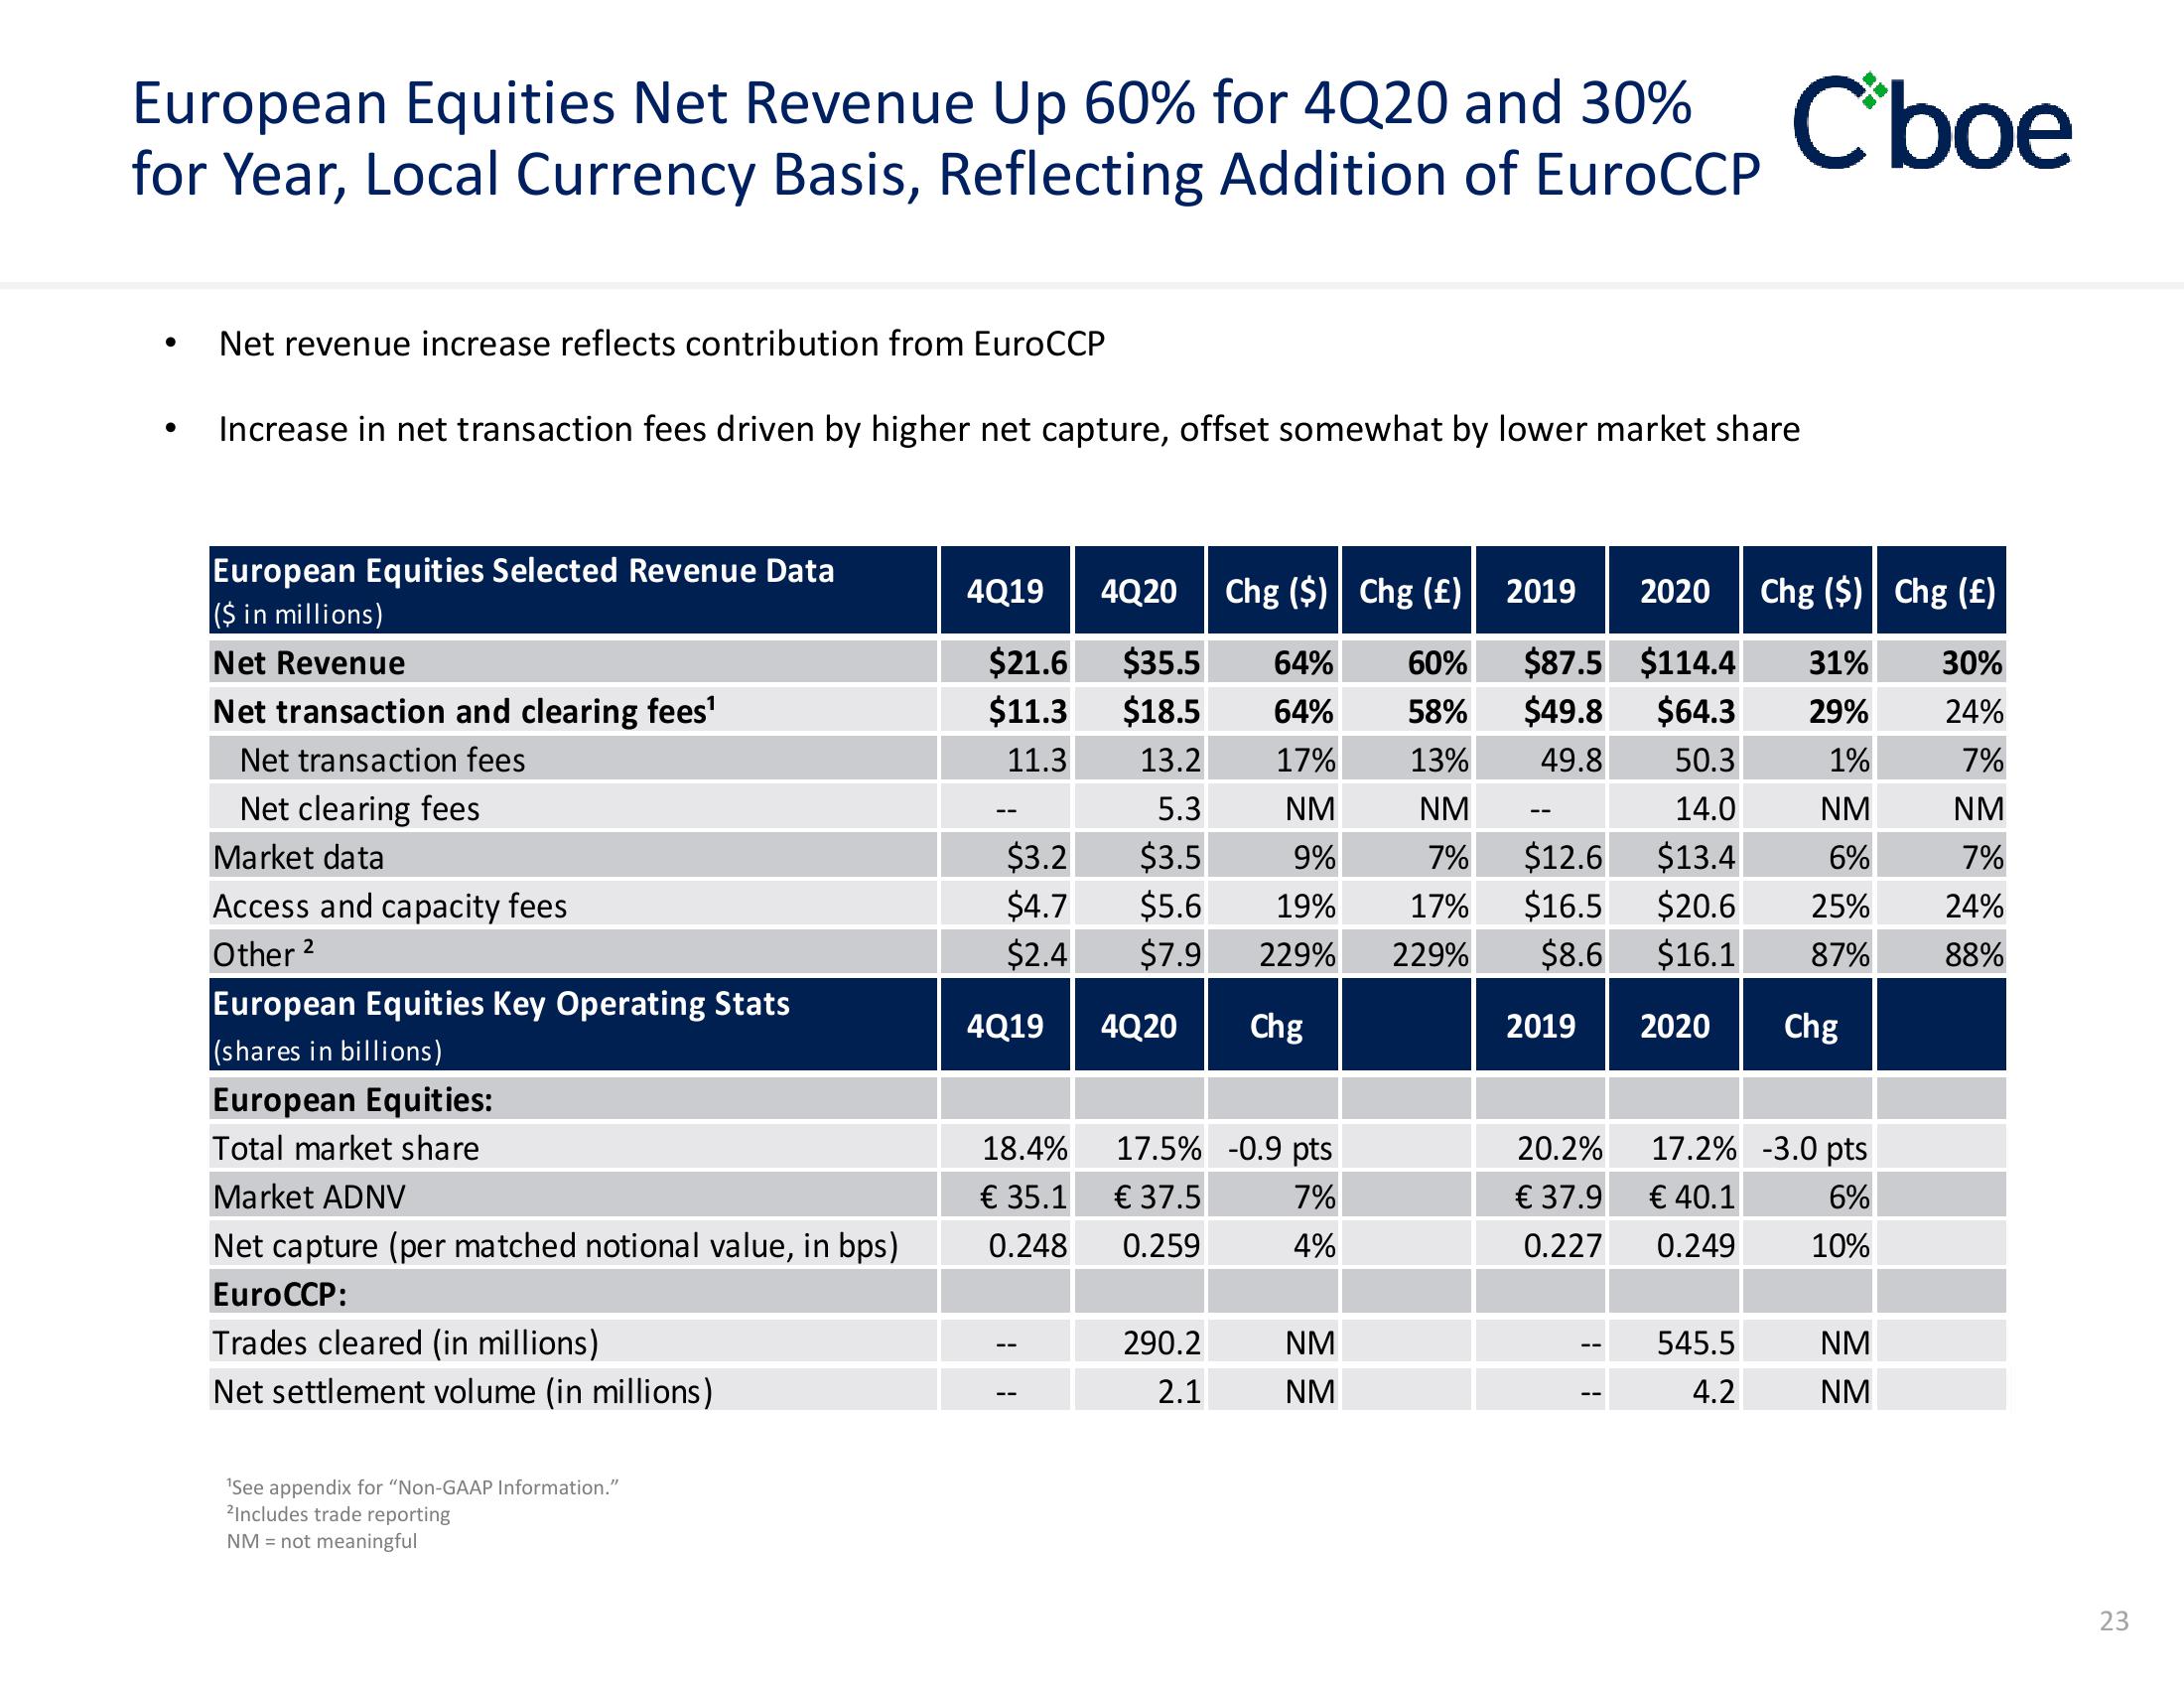
European Equities Net Revenue Up 60% for 4Q20 and 30% C'boe
for Year, Local Currency Basis, Reflecting Addition of EuroCCP
●
●
Net revenue increase reflects contribution from EuroCCP
Increase in net transaction fees driven by higher net capture, offset somewhat by lower market share
European Equities Selected Revenue Data
($ in millions)
Net Revenue
Net transaction and clearing fees¹
Net transaction fees
Net clearing fees
Market data
Access and capacity fees
Other
2
European Equities Key Operating Stats
(shares in billions)
European Equities:
Total market share
Market ADNV
Net capture (per matched notional value, in bps)
EuroCCP:
Trades cleared (in millions)
Net settlement volume (in millions)
¹See appendix for "Non-GAAP Information."
2Includes trade reporting
NM = not meaningful
4Q19
$21.6
$11.3
11.3
$3.2
$4.7
$2.4
4Q19
18.4%
€ 35.1
0.248
4Q20 Chg ($) | Chg (£)
$35.5 64%
$18.5 64%
13.2
17%
NM
9%
19%
17%
229% 229%
Chg
5.3
$3.5
$5.6
$7.9
4Q20
17.5% -0.9 pts
€ 37.5
7%
0.259
4%
290.2
2.1
NM
NM
2019 2020 Chg ($) | Chg (£)
60%
$87.5 $114.4 31%
58% $49.8 $64.3 29%
13%
49.8
50.3
1%
NM
14.0
NM
7% $12.6
$13.4
6%
$16.5 $20.6 25%
$8.6 $16.1
87%
2019 2020
20.2%
€ 37.9
0.227
Chg
17.2% -3.0 pts
€ 40.1
6%
0.249
10%
545.5
4.2
NM
NM
30%
24%
7%
NM
7%
24%
88%
23View entire presentation