Phreesia Investor Presentation Deck
Phreesia
$ and shares in Millions
Revenue:
Subscription and related services
Payment processing fees
Total healthcare services revenues
% Growth
Life Sciences
% Growth
Total revenues
% YoY Growth
Expenses:
Cost of revenue (excl. depreciation and amortization)
Payment processing expense
Sales and Marketing
Research and development
General administrative
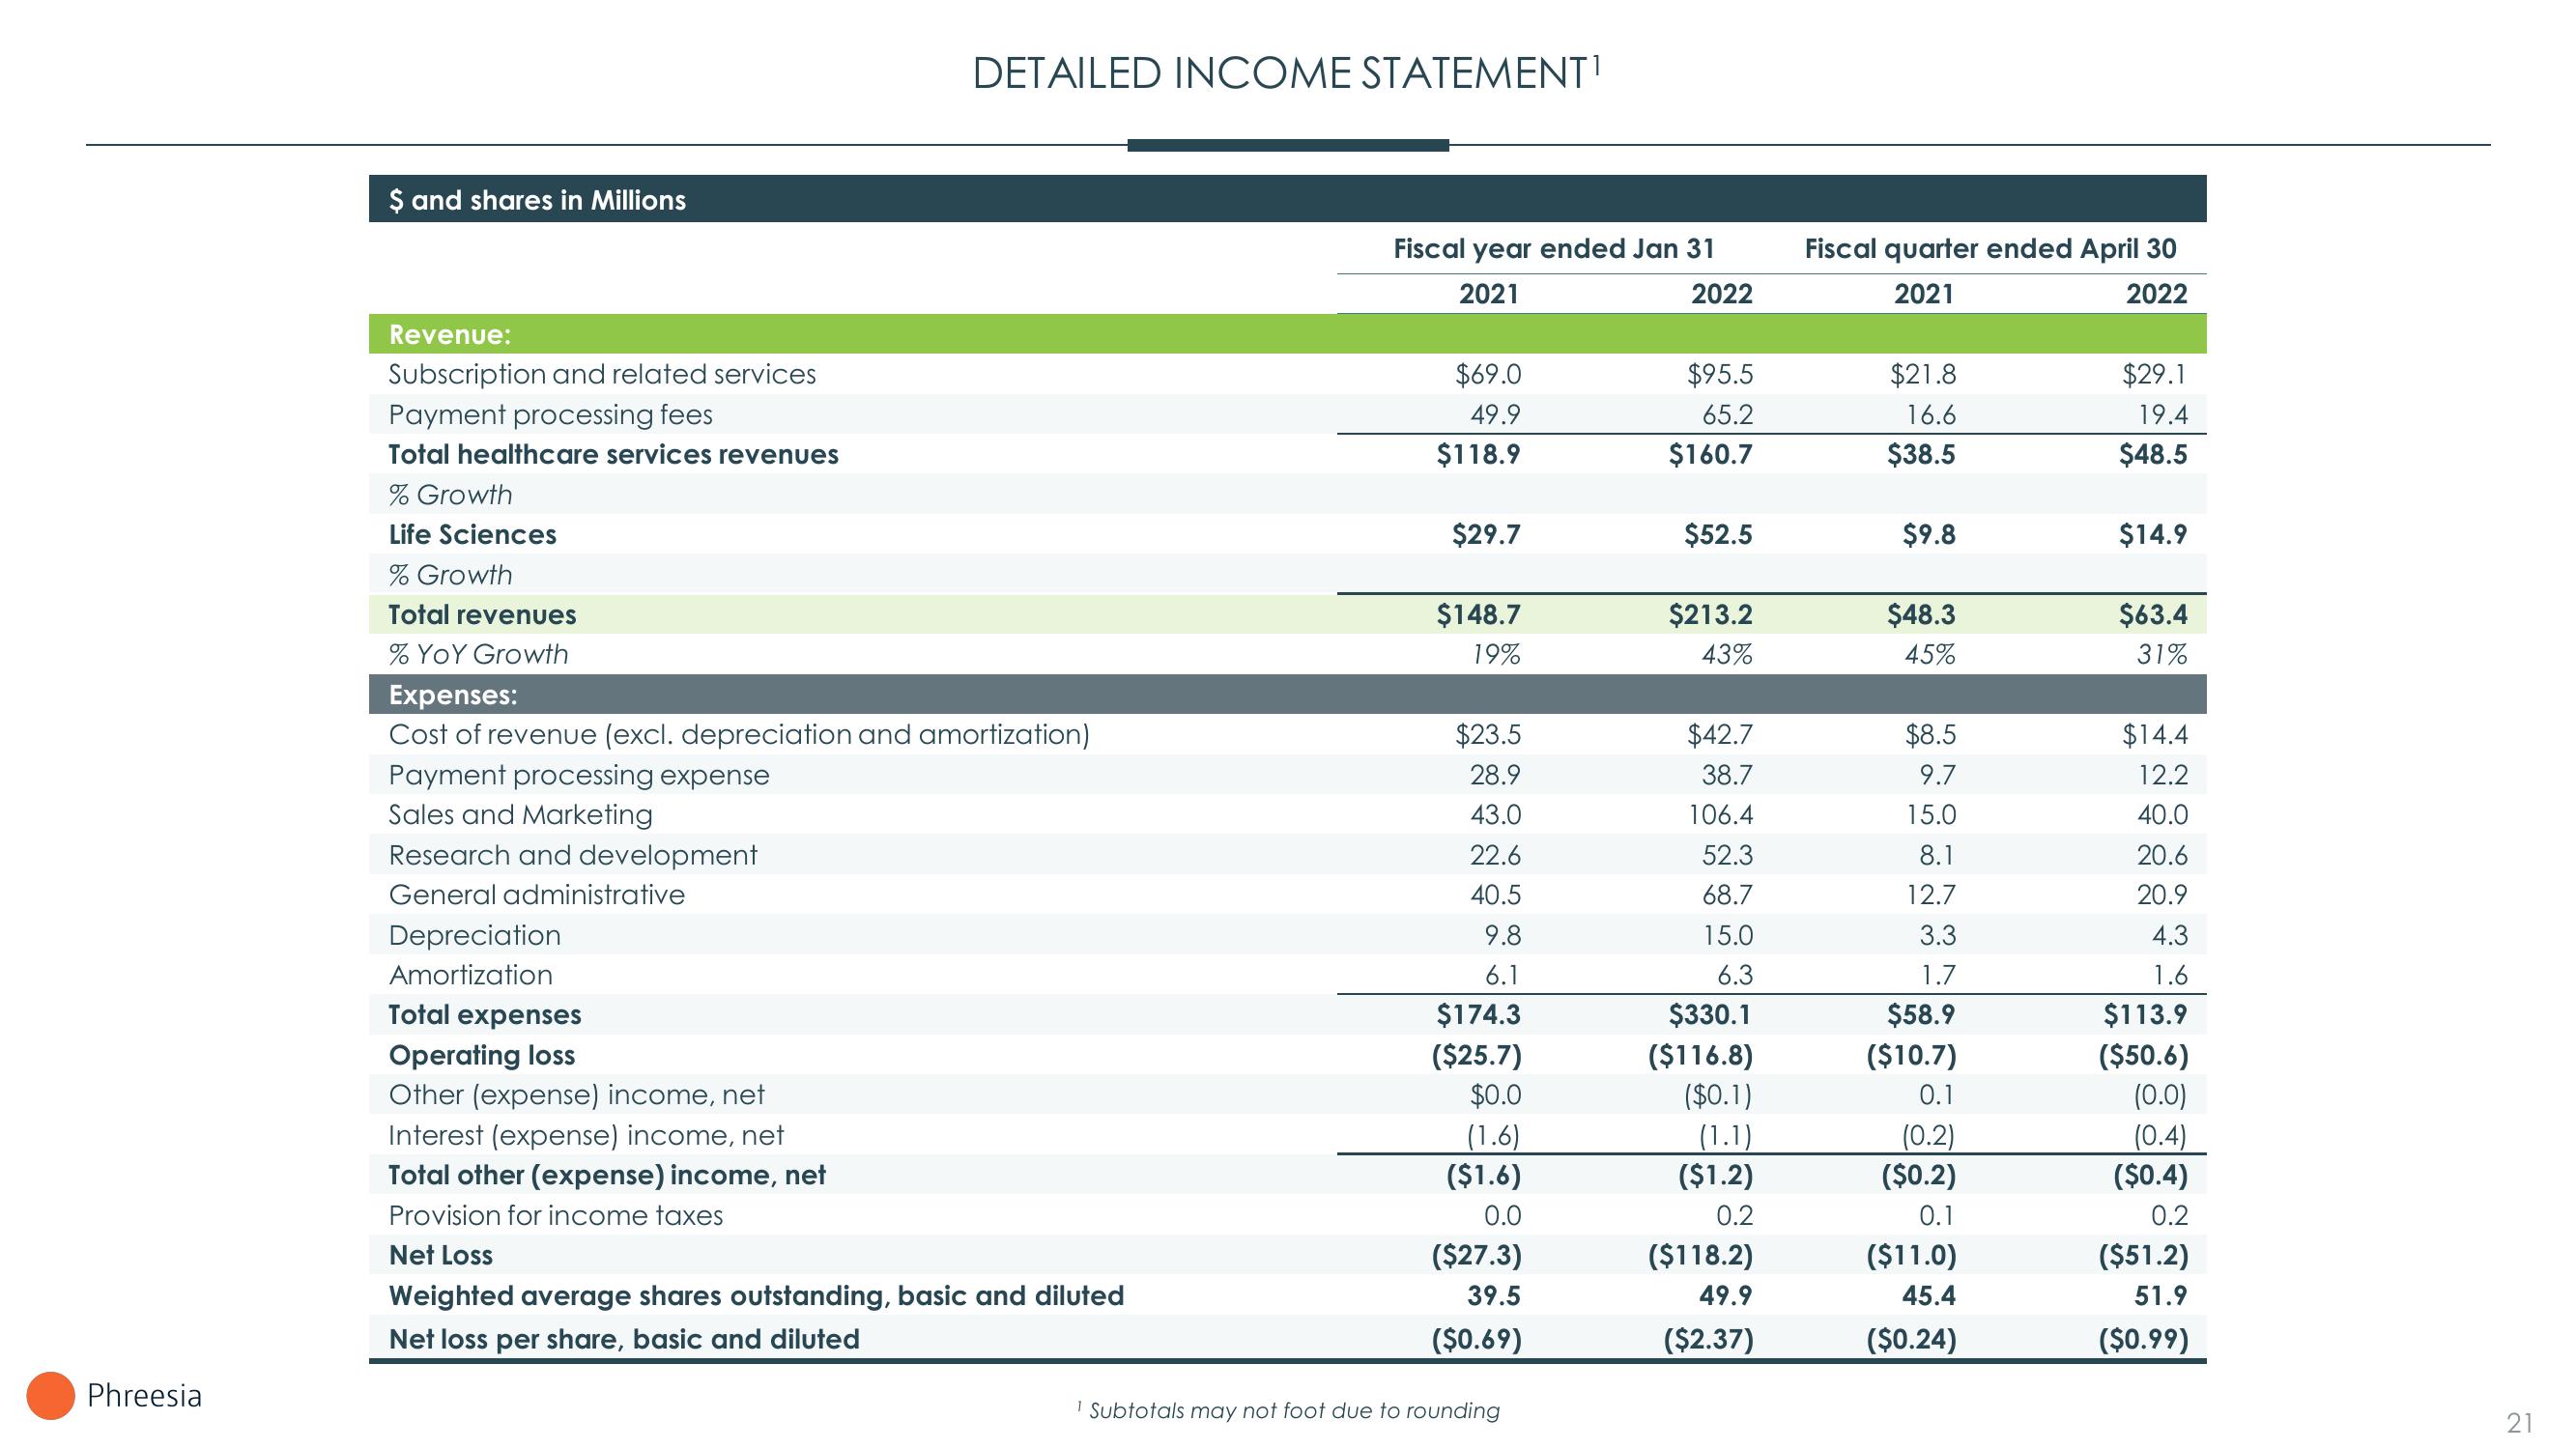
DETAILED INCOME STATEMENT¹
Depreciation
Amortization
Total expenses
Operating loss
Other (expense) income, net
Interest (expense) income, net
Total other (expense) income, net
Provision for income taxes
Net Loss
Weighted average shares outstanding, basic and diluted
Net loss per share, basic and diluted
Fiscal year ended Jan 31
2021
$69.0
49.9
$118.9
$29.7
$148.7
19%
$23.5
28.9
43.0
22.6
40.5
9.8
6.1
$174.3
($25.7)
$0.0
(1.6)
($1.6)
0.0
($27.3)
39.5
($0.69)
¹ Subtotals may not foot due to rounding
2022
$95.5
65.2
$160.7
$52.5
$213.2
43%
$42.7
38.7
106.4
52.3
68.7
15.0
6.3
$330.1
($116.8)
($0.1)
(1.1)
($1.2)
0.2
($118.2)
49.9
($2.37)
Fiscal quarter ended April 30
2021
2022
$21.8
16.6
$38.5
$9.8
$48.3
45%
$8.5
9.7
15.0
8.1
12.7
3.3
1.7
$58.9
($10.7)
0.1
(0.2)
($0.2)
0.1
($11.0)
45.4
($0.24)
$29.1
19.4
$48.5
$14.9
$63.4
31%
$14.4
12.2
40.0
20.6
20.9
4.3
1.6
$113.9
($50.6)
(0.0)
(0.4)
($0.4)
0.2
($51.2)
51.9
($0.99)
21View entire presentation