Maersk Results Presentation Deck
Maersk Group
- Interim Report 03 2015
NOTE 6 SHARE CAPITAL AND EARNINGS PER SHARE
AMOUNTS IN USD MILLION
Development in the number of shares:
A-shares of
DKK 1,000
1 January 2015
Cancellation
Conversion
30 September 2015
Own shares
Development in the holding of own shares:
A SHARES
1 January
Addition
Cancellation
.………...…...
30 September
10,988,834
86,500
7
B SHARES
1 January
Addition
Cancellation
Disposal
30 September
10,902,341
= Contents
61,075
40,397
86,500
14,972
DKK 500
342,066
165,941
346,118
17,511
144,378
332
No. of shares of DKK 1,000
2015
2014
-14
318
Notes / Financials
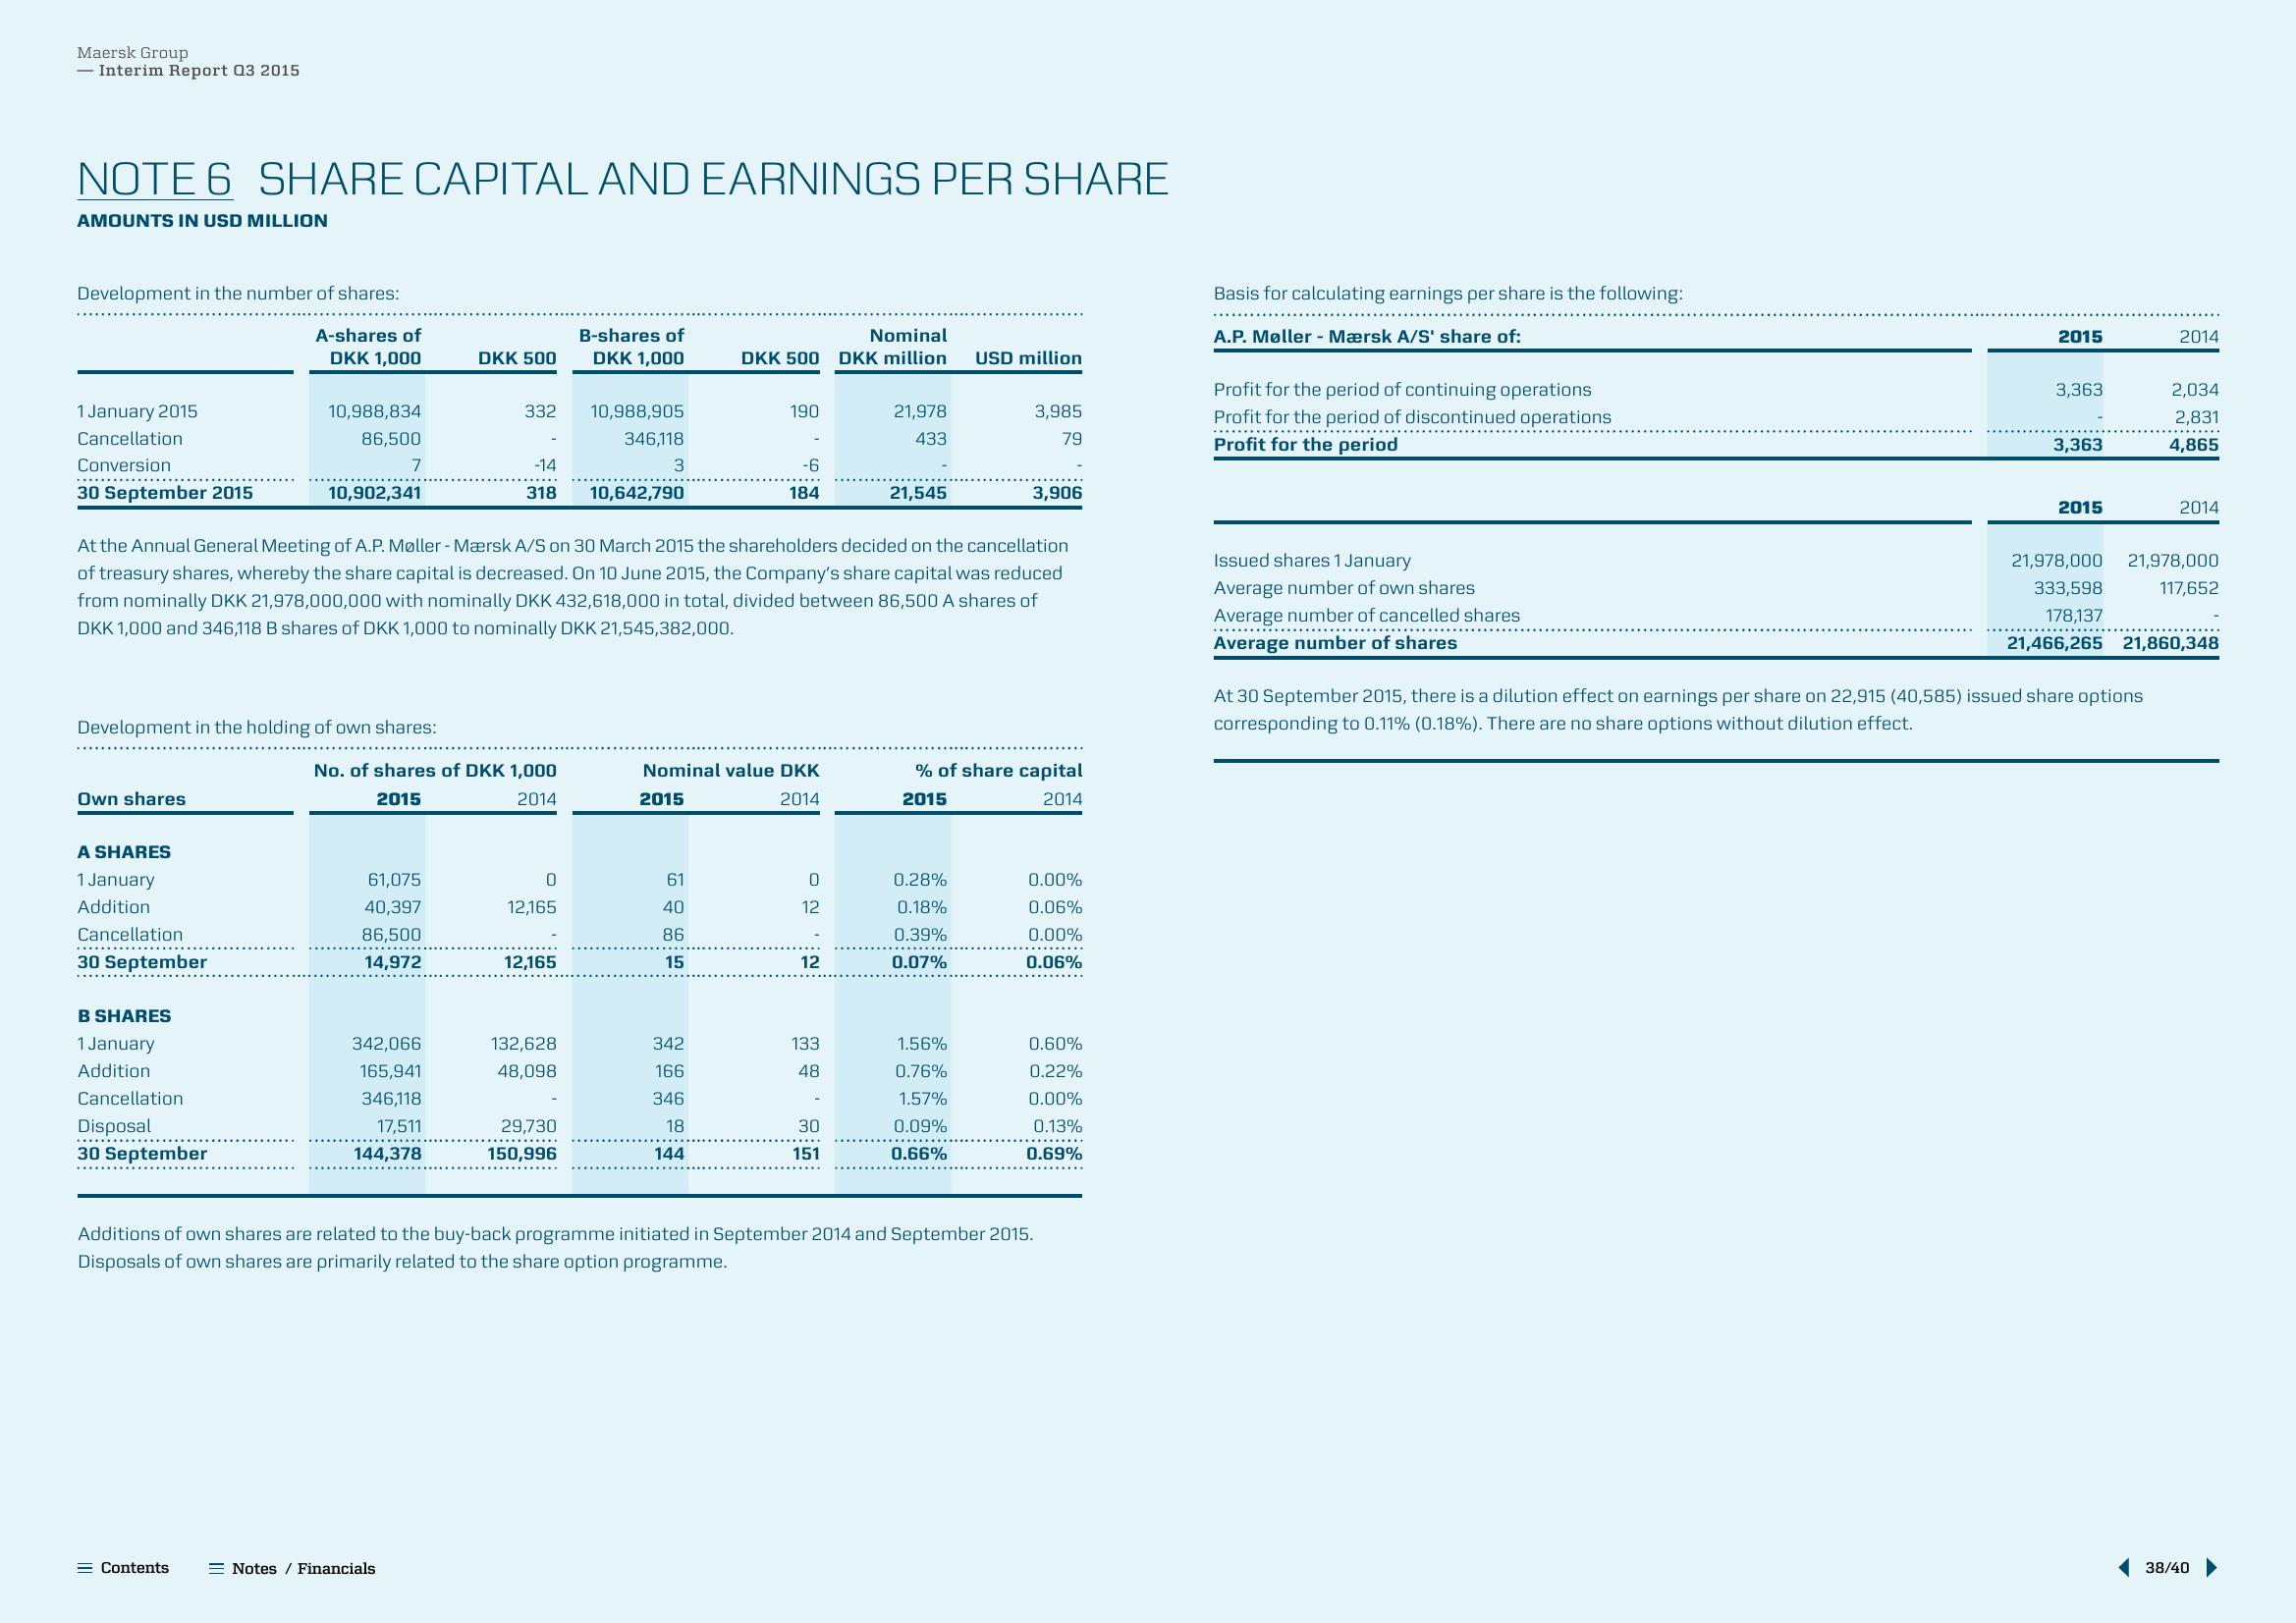
At the Annual General Meeting of A.P. Møller-Mærsk A/S on 30 March 2015 the shareholders decided on the cancellation
of treasury shares, whereby the share capital is decreased. On 10 June 2015, the Company's share capital was reduced
from nominally DKK 21,978,000,000 with nominally DKK 432,618,000 in total, divided between 86,500 A shares of
DKK 1,000 and 346,118 B shares of DKK 1,000 to nominally DKK 21,545,382,000.
0
12,165
12,165
132,628
48,098
B-shares of
DKK 1,000
29,730
150,996
10,988,905
346,118
3
10,642,790
DKK 500
61
40
86
15
190
342
166
346
18
144
-6
184
Nominal value DKK
2015
2014
0
12
12
133
48
Nominal
DKK million
30
151
21,978
433
21,545
USD million
0.28%
0.18%
0.39%
0.07%
1.56%
0.76%
1.57%
0.09%
0.66%
3,985
79
3,906
% of share capital
2015
2014
Additions of own shares are related to the buy-back programme initiated in September 2014 and September 2015.
Disposals of own shares. primarily related to the share option programme.
0.00%
0.06%
0.00%
0.06%
0.60%
0.22%
0.00%
0.13%
0.69%
Basis for calculating earnings per share is the following:
A.P. Møller-Mærsk A/S' share of:
Profit for the period of continuing operations
Profit for the period of discontinued operations
Profit for the period
Issued shares 1 January
Average number of own shares
Average number of cancelled shares
Average number of shares
2015
3,363
3,363
2015
2014
2,034
2,831
4,865
At 30 September 2015, there is a dilution effect on earnings per share on 22,915 (40,585) issued share options
corresponding to 0.11% (0.18%). There are no share options without dilution effect.
2014
21,978,000
333,598
178,137
21,466,265 21,860,348
21,978,000
117,652
38/40View entire presentation