Bird Investor Presentation Deck
Components of metrics & non-GAAP reconciliations
(in millions)
Gross Transaction Value¹
Contra Revenue
Platform Adjustment
Revenue¹
Product Sales Revenue
Sharing Revenue¹
Gross Margin
Vehicle Depreciation
Net Impact of Product Sales Division²
Sharing gross margin (before vehicle depreciation)
% of Sharing Revenue
Vehicle Depreciation
Sharing gross margin (after vehicle depreciation)
% of Sharing Revenue
Net Income (Loss)
Net Interest (Income) Expense
Income Tax
Depreciation & Amortization
Vehicle Count Adjustments
Stock Based Compensation
Tariff Refunds
Net Other (Income) Expense Including Foreign Currency
Settlements and Appeasements
Impairment of inventory and inventory deposits
Impairment of Assets
Non-recurring, non-cash, or non-core items
One-time IPO activities
Adjusted EBITDA
% of Revenue
BIRD
FY2019A
FY
$161.9
$(10.6)
$(0.8)
$150.5
$(10.1)
$140.4
$(135.7)
$112.2
$10.2
$(13.2)
(9)%
$(112.2)
$(125.4)
(89)%
$(387.5)
$5.0
$0.3
$116.1
$9.7
$30.6
$0.0
$(3.0)
$0.8
$0.0
$0.0
$0.0
$0.0
$(228.0)
(151)%
FY2020A
FY
$115.2
$(15.1)
$(10.0)
$90.1
$(14.7)
$75.4
$(25.9)
$23.8
$8.1
$6.0
8%
$(23.8)
$(17.8)
(24)%
$(208.7)
$6.6
$0.1
$35.4
$3.4
$6.1
$(25.0)
$(5.9)
$6.7
$0.0
$0.0
$0.0
$0.0
$(181.4)
(201)%
Q1
$31.3
$(4.7)
$(2.3)
$24.2
$(4.0)
$20.2
$0.6
$5.0
$0.3
$5.9
29 %
$(5.0)
$0.9
5%
$(76.8)
$1.6
$0.0
$6.9
$(0.2)
$1.5
$0.0
$35.7
$1.2
$0.0
$0.0
$0.0
$0.0
$(30.1)
(124)%
Q2
$71.2
$(10.9)
$(6.1)
$55.7
$(3.4)
$52.2
$10.1
$11.5
$0.0
$21.7
42%
$(11.5)
$10.2
19%
$(49.3)
$3.1
$0.1
$13.5
$(0.3)
$1.3
$0.0
$14.5
$0.2
$0.0
$0.0
$(0.2)
$0.0
$(17.1)
(31)%
FY2021A
Q3
$79.5
$(10.9)
$(7.5)
$61.1
$(1.4)
$59.7
$8.2
$17.3
$(0.0)
$25.5
43%
$(17.3)
$8.2
14%
$(41.2)
$0.3
$0.0
$19.2
$0.6
$1.5
$0.0
$10.0
$0.5
$0.0
$0.0
$0.0
$0.0
$(9.9)
(16)%
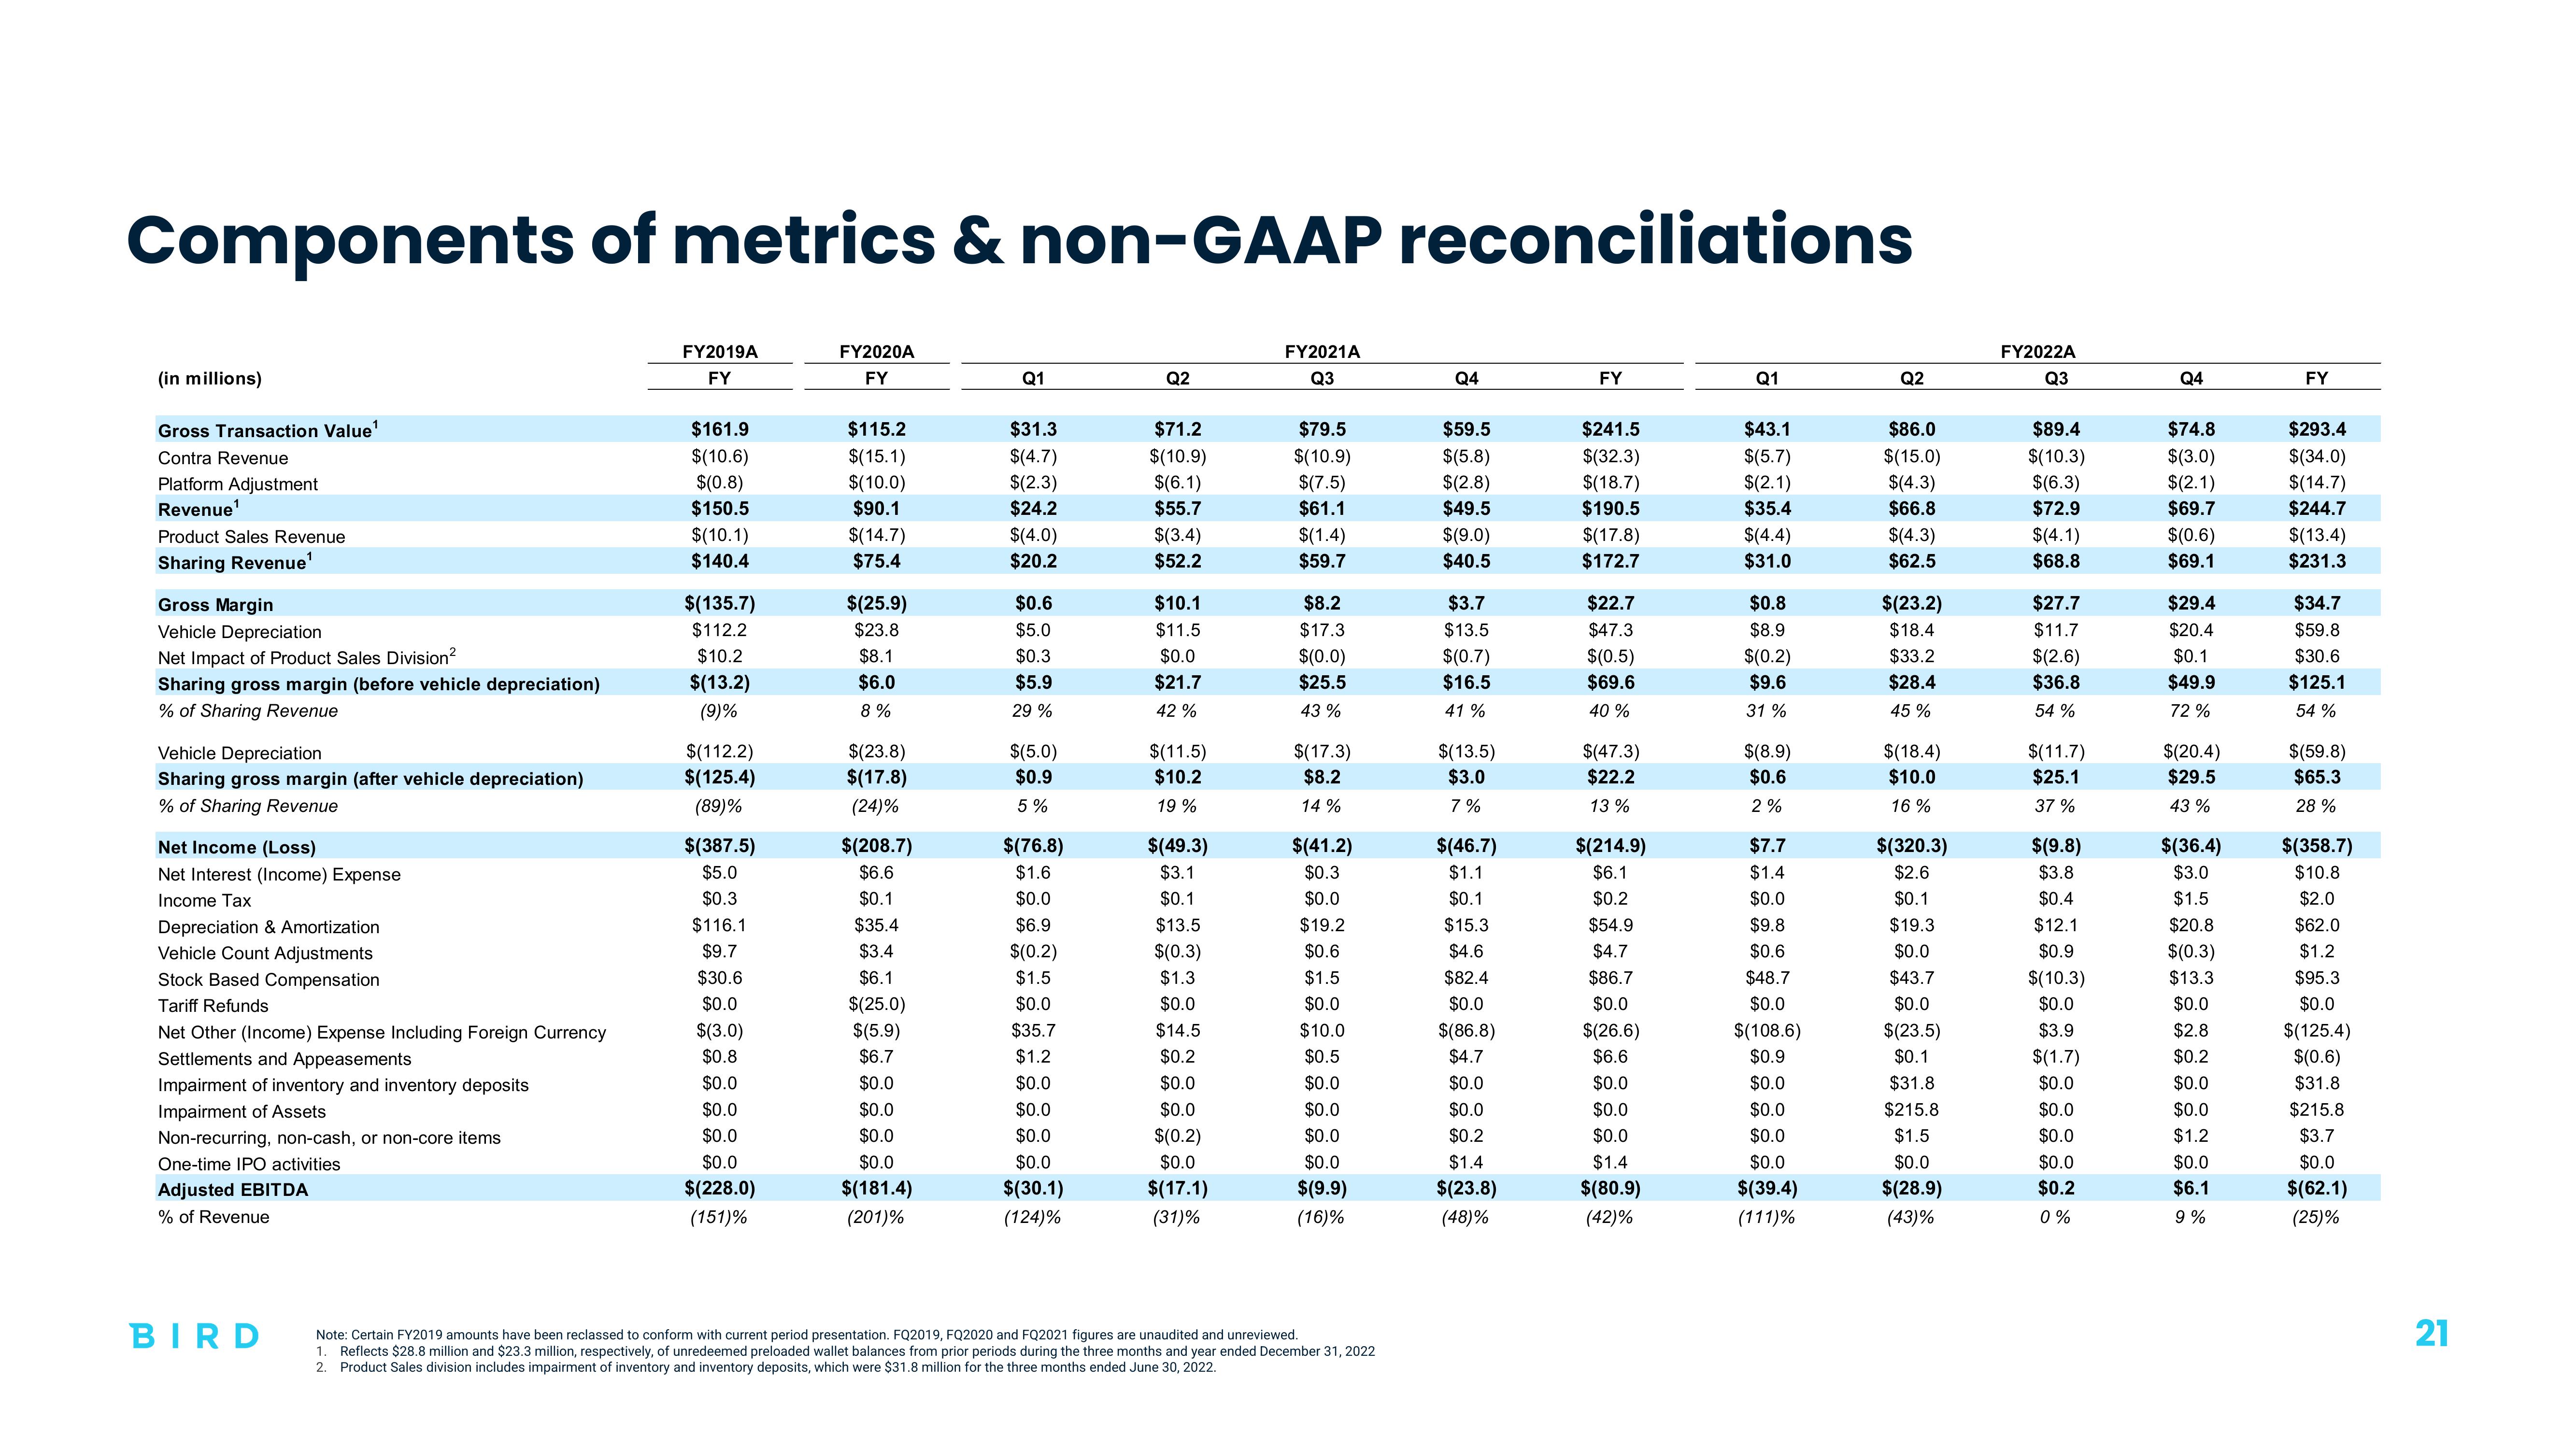
Note: Certain FY2019 amounts have been reclassed to conform with current period presentation. FQ2019, FQ2020 and FQ2021 figures are unaudited and unreviewed.
1. Reflects $28.8 million and $23.3 million, respectively, of unredeemed preloaded wallet balances from prior periods during the three months and year ended December 31, 2022
2. Product Sales division includes impairment of inventory and inventory deposits, which were $31.8 million for the three months ended June 30, 2022.
Q4
$59.5
$(5.8)
$(2.8)
$49.5
$(9.0)
$40.5
$3.7
$13.5
$(0.7)
$16.5
41%
$(13.5)
$3.0
7%
$(46.7)
$1.1
$0.1
$15.3
$4.6
$82.4
$0.0
$(86.8)
$4.7
$0.0
$0.0
$0.2
$1.4
$(23.8)
(48)%
FY
$241.5
$(32.3)
$(18.7)
$190.5
$(17.8)
$172.7
$22.7
$47.3
$(0.5)
$69.6
40 %
$(47.3)
$22.2
13%
$(214.9)
$6.1
$0.2
$54.9
$4.7
$86.7
$0.0
$(26.6)
$6.6
$0.0
$0.0
$0.0
$1.4
$(80.9)
(42)%
Q1
$43.1
$(5.7)
$(2.1)
$35.4
$(4.4)
$31.0
$0.8
$8.9
$(0.2)
$9.6
31%
$(8.9)
$0.6
2%
$7.7
$1.4
$0.0
$9.8
$0.6
$48.7
$0.0
$(108.6)
$0.9
$0.0
$0.0
$0.0
$0.0
$(39.4)
(111)%
Q2
$86.0
$(15.0)
$(4.3)
$66.8
$(4.3)
$62.5
$(23.2)
$18.4
$33.2
$28.4
45 %
$(18.4)
$10.0
16%
$(320.3)
$2.6
$0.1
$19.3
$0.0
$43.7
$0.0
$(23.5)
$0.1
$31.8
$215.8
$1.5
$0.0
$(28.9)
(43)%
FY2022A
Q3
$89.4
$(10.3)
$(6.3)
$72.9
$(4.1)
$68.8
$27.7
$11.7
$(2.6)
$36.8
54%
$(11.7)
$25.1
37 %
$(9.8)
$3.8
$0.4
$12.1
$0.9
$(10.3)
$0.0
$3.9
$(1.7)
$0.0
$0.0
$0.0
$0.0
$0.2
0%
Q4
$74.8
$(3.0)
$(2.1)
$69.7
$(0.6)
$69.1
$29.4
$20.4
$0.1
$49.9
72%
$(20.4)
$29.5
43%
$(36.4)
$3.0
$1.5
$20.8
$(0.3)
$13.3
$0.0
$2.8
$0.2
$0.0
$0.0
$1.2
$0.0
$6.1
9%
FY
$293.4
$(34.0)
$(14.7)
$244.7
$(13.4)
$231.3
$34.7
$59.8
$30.6
$125.1
54%
$(59.8)
$65.3
28%
$(358.7)
$10.8
$2.0
$62.0
$1.2
$95.3
$0.0
$(125.4)
$(0.6)
$31.8
$215.8
$3.7
$0.0
$(62.1)
(25)%
21View entire presentation