Kore Results Presentation Deck
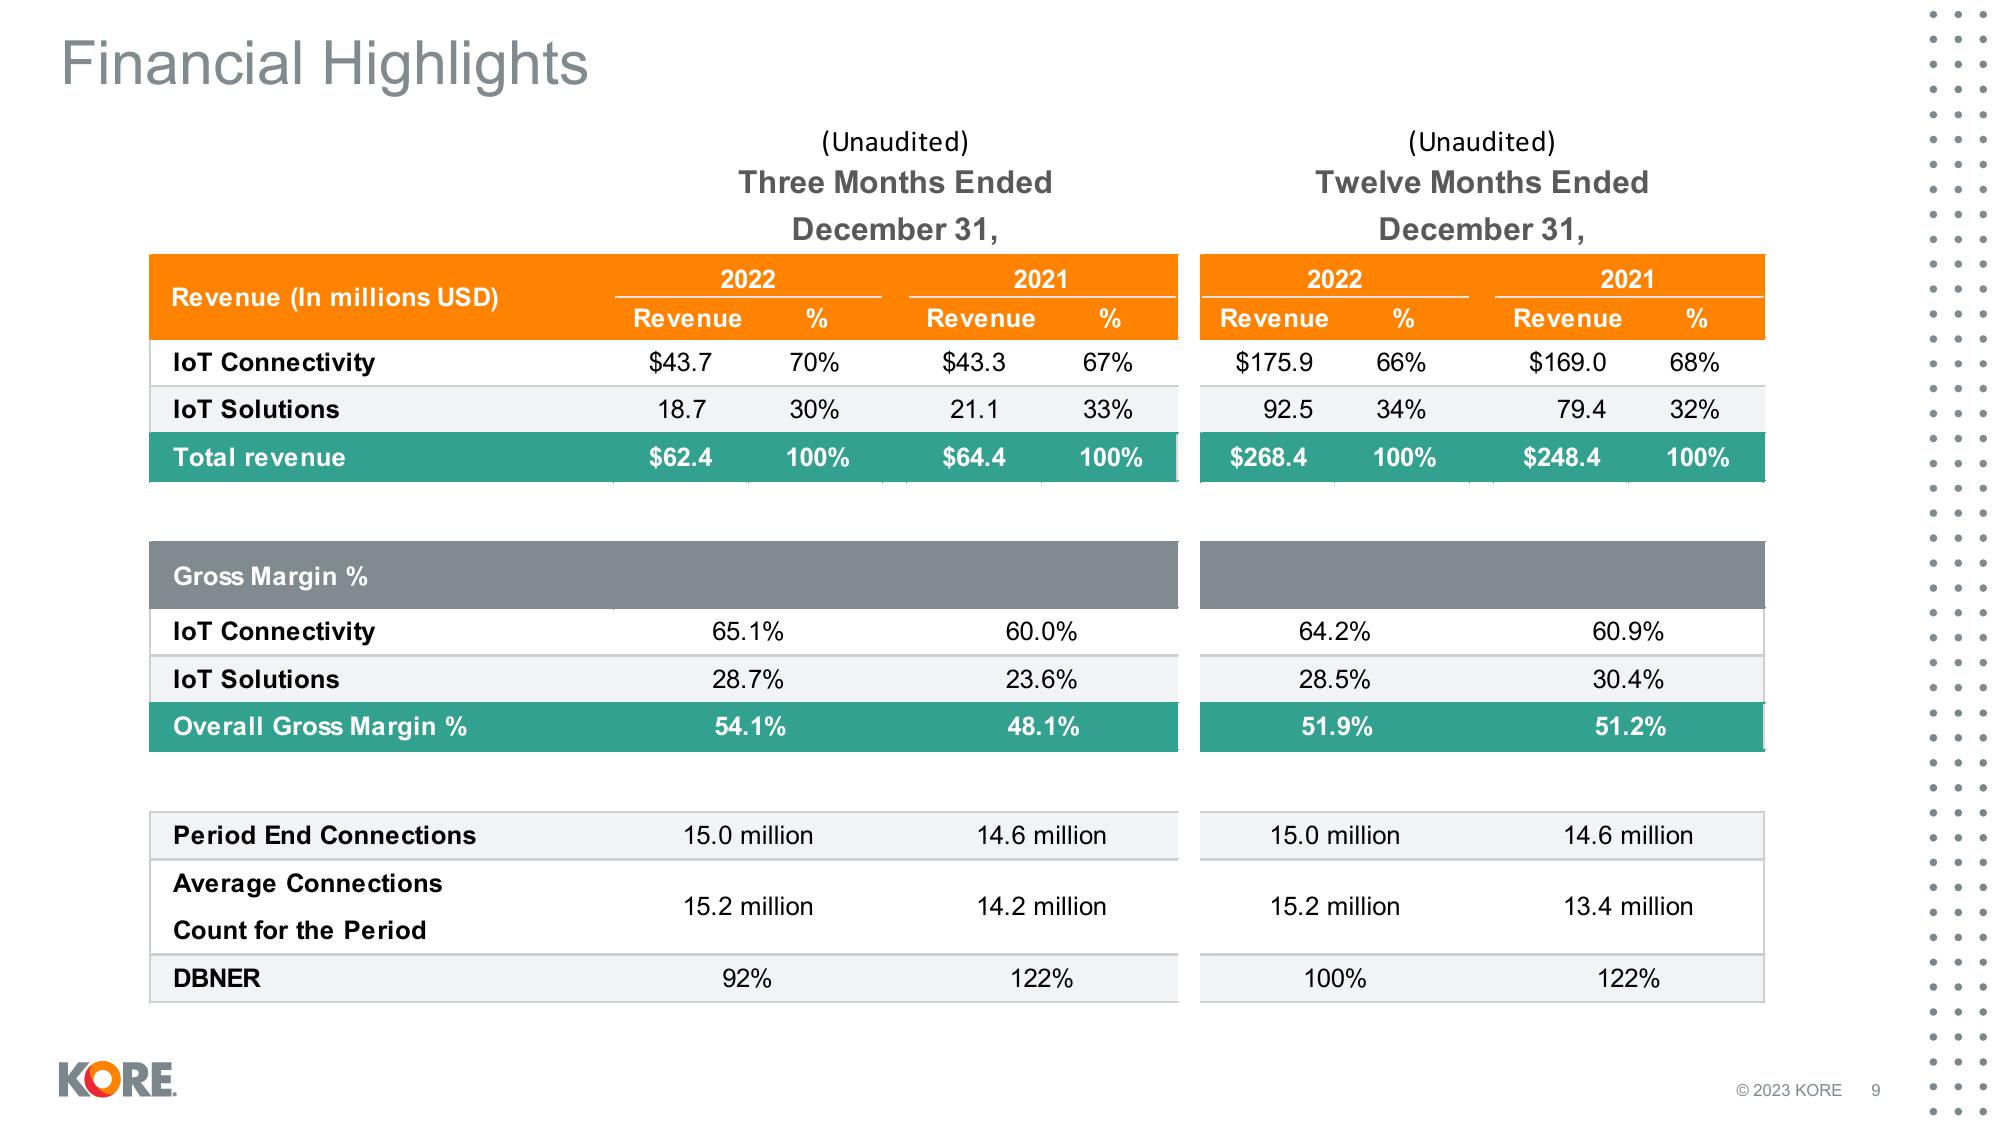
Financial Highlights
Revenue (In millions USD)
IoT Connectivity
IoT Solutions
Total revenue
Gross Margin %
IoT Connectivity
loT Solutions
Overall Gross Margin %
Period End Connections
Average Connections
Count for the Period
DBNER
KORE
(Unaudited)
Three Months Ended
December 31,
2022
Revenue
$43.7
18.7
$62.4
65.1%
28.7%
54.1%
%
70%
30%
100%
15.0 million
15.2 million
92%
2021
Revenue
$43.3
21.1
$64.4
60.0%
23.6%
48.1%
%
67%
33%
100%
14.6 million
14.2 million
122%
(Unaudited)
Twelve Months Ended
December 31,
2022
Revenue
$175.9
92.5
$268.4
64.2%
28.5%
51.9%
%
66%
34%
100%
15.0 million
15.2 million
100%
2021
Revenue
$169.0
79.4
$248.4
60.9%
30.4%
51.2%
%
68%
32%
100%
14.6 million
13.4 million
122%
© 2023 KORE 9
●
●
● ● ●
●
●
●
●
●
●
..
●●
●
.
●
●
● ●
●
●
●
●
● ●
●
•
● ●
●
...
e
●
● ●View entire presentation