dLocal Investor Day Presentation Deck
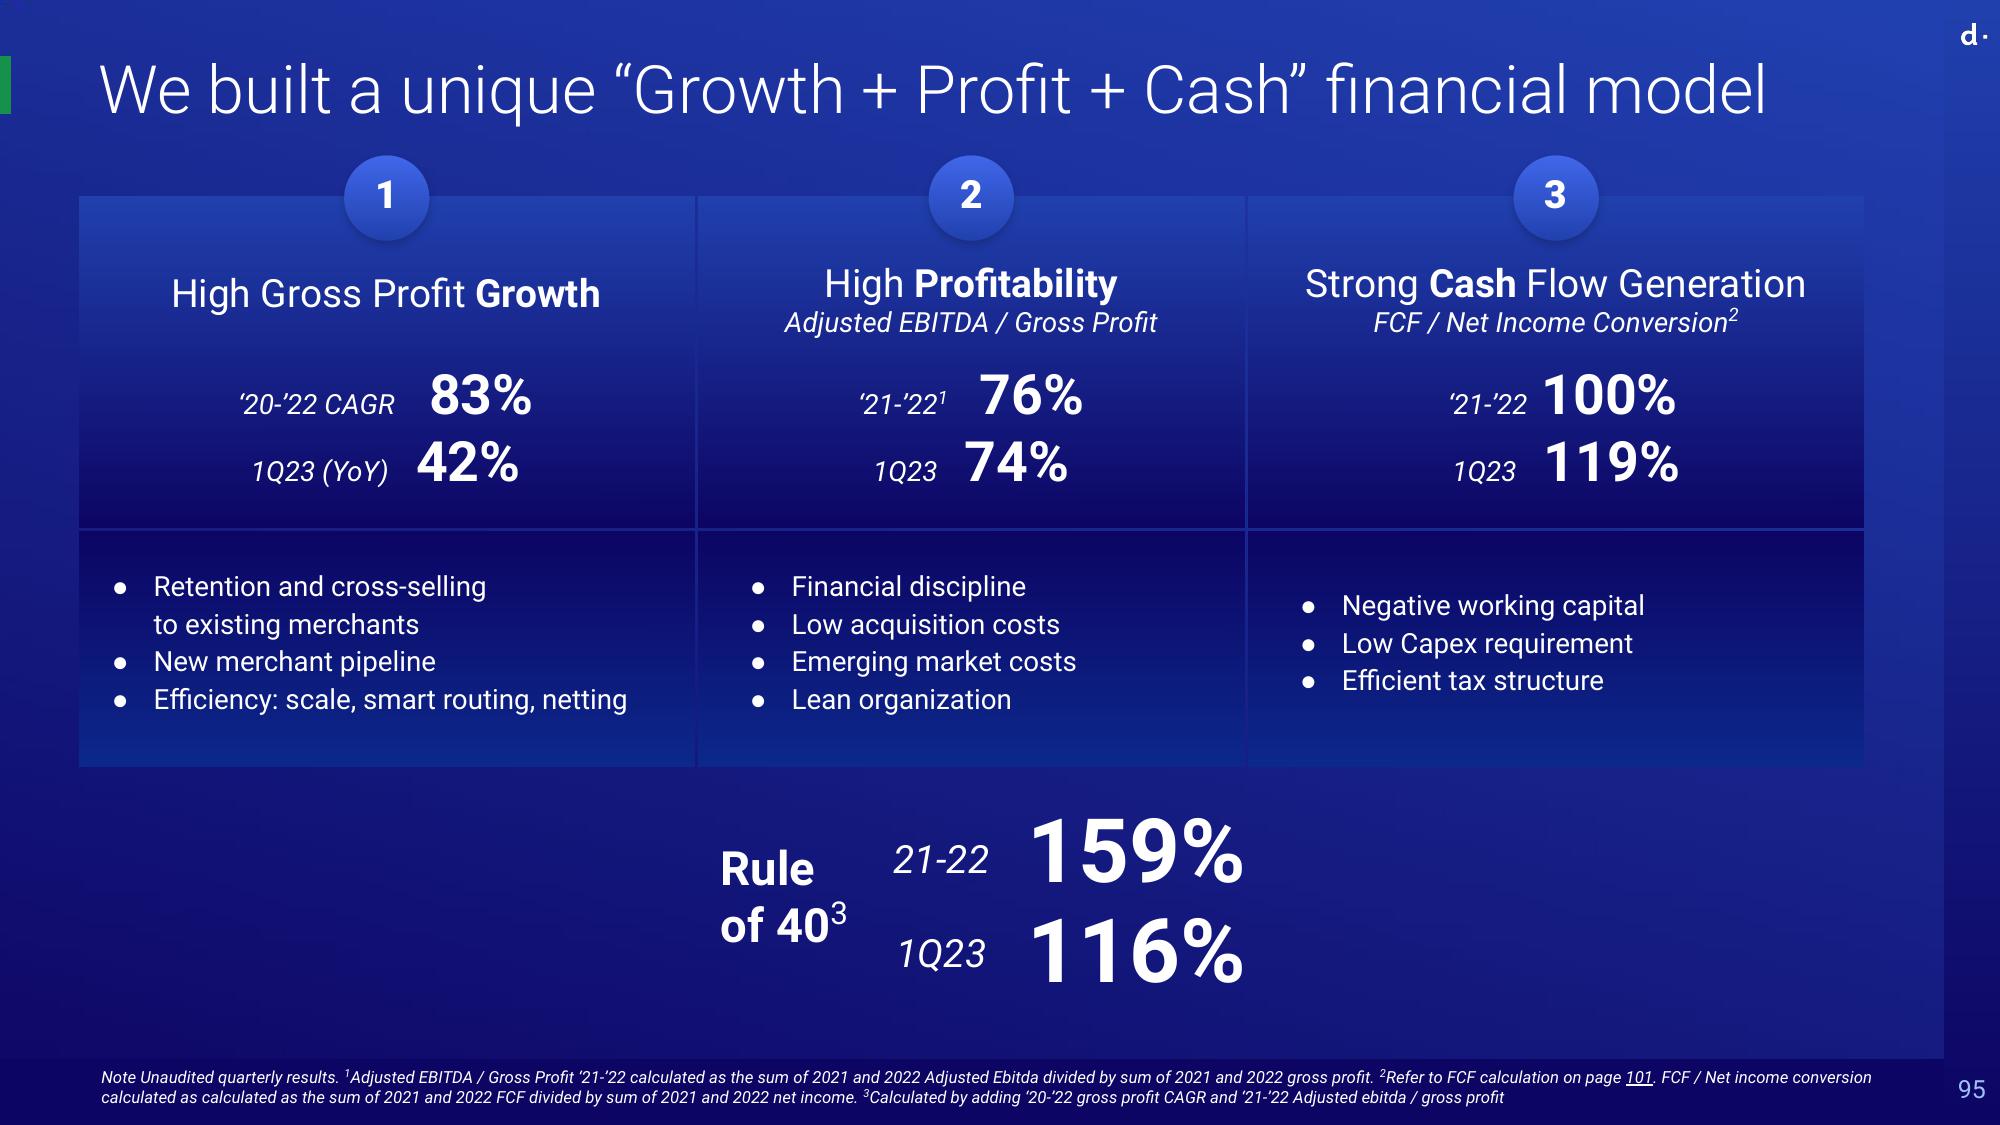
We built a unique "Growth + Profit + Cash” financial model
1
High Gross Profit Growth
20-22 CAGR 83%
1Q23 (YoY) 42%
Retention and cross-selling
to existing merchants
New merchant pipeline
• Efficiency: scale, smart routing, netting
2
High Profitability
Adjusted EBITDA / Gross Profit
Rule
of 40³
21-22¹ 76%
1Q23 74%
Financial discipline
Low acquisition costs
• Emerging market costs
Lean organization
21-22 159%
1Q23
116%
3
Strong Cash Flow Generation
FCF / Net Income Conversion²
21-22 100%
1Q23 119%
Negative working capital
Low Capex requirement
Efficient tax structure
Note Unaudited quarterly results. 'Adjusted EBITDA/Gross Profit '21-22 calculated as the sum of 2021 and 2022 Adjusted Ebitda divided by sum of 2021 and 2022 gross profit. 2Refer to FCF calculation on page 101. FCF/Net income conversion
calculated as calculated as the sum of 2021 and 2022 FCF divided by sum of 2021 and 2022 net income. ³Calculated by adding '20-22 gross profit CAGR and '21-22 Adjusted ebitda / gross profit
d.
95View entire presentation